|
<< Click to Display Table of Contents >> Options Tab |
  
|
|
<< Click to Display Table of Contents >> Options Tab |
|
The Options tab is used to specify a variety of format options for the charts.
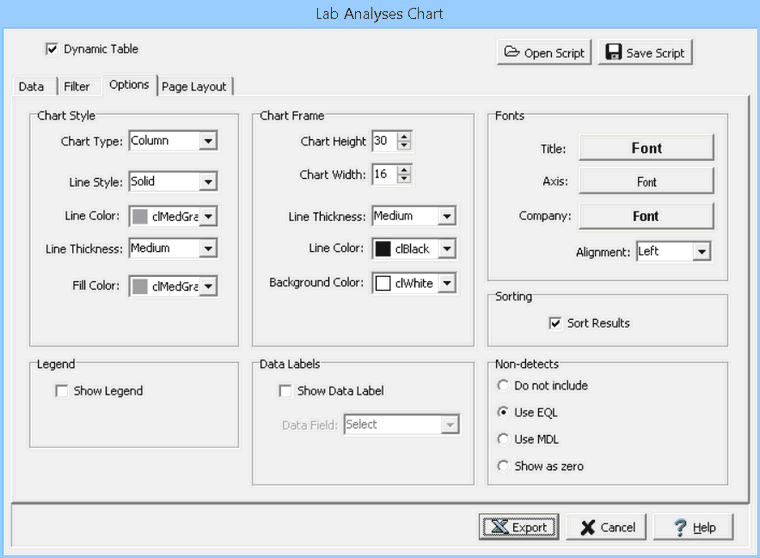
The following can be specified on this tab:
Chart Style
Chart Type: This is used to select the type of chart. The types of chart are area, column, line, or XY scatter.
Line Style: This is used to select the line style for the chart.
Line Color: This is used to select the line color for the chart.
Line Thickness: This is used to specify the line thickness.
Fill Color: This is used to select the fill color.
Marker Style: If the chart type is line or XY scatter, this is used to select the marker style for the chart.
Chart Frame
Chart Height: This is the chart height in rows.
Chart Width: This is the chart width in columns.
Frame Line Thickness: This is the line thickness of the frame around the chart.
Frame Line Color: This is used to select the line color for the frame.
Frame Background Color: This is used to select the background color of the frame.
Fonts
Title Font: This is used to select the font for the chart title.
Axis Font: This is used to select the font for the chart axes.
Company Font: This is used to select the company font for the company name and address specified in the Page Layout tab.
Company Alignment: This is used to select the alignment for the company name and address.
Sorting
Sorting: Check this box to sort the results on the chart.
Legend
Show Legend: If checked a legend will be displayed on the chart.
Legend Position: If a legend is being displayed, the position of the legend can be selected.
Data Labels
Show Data Labels: If checked, labels will be displayed at each data point on the chart.
Label Data Field: If labels are being displayed, the data field for the labels can be selected.
Non-Detects
Non-detect Text: If the data label is "Concentration", the text to display for a non-detect can be specified.
Non-Detects: Non-detects can not be shown of shown as the EQL, MDL, or zero.