|
<< Click to Display Table of Contents >> Network Data Monitor |
  
|
|
<< Click to Display Table of Contents >> Network Data Monitor |
|
The GaeaSynergy 4 Network Data Monitor is used to control the preference settings, monitor the schedule and queue, and show the EDI history. When the application is started the monitor form will be displayed.
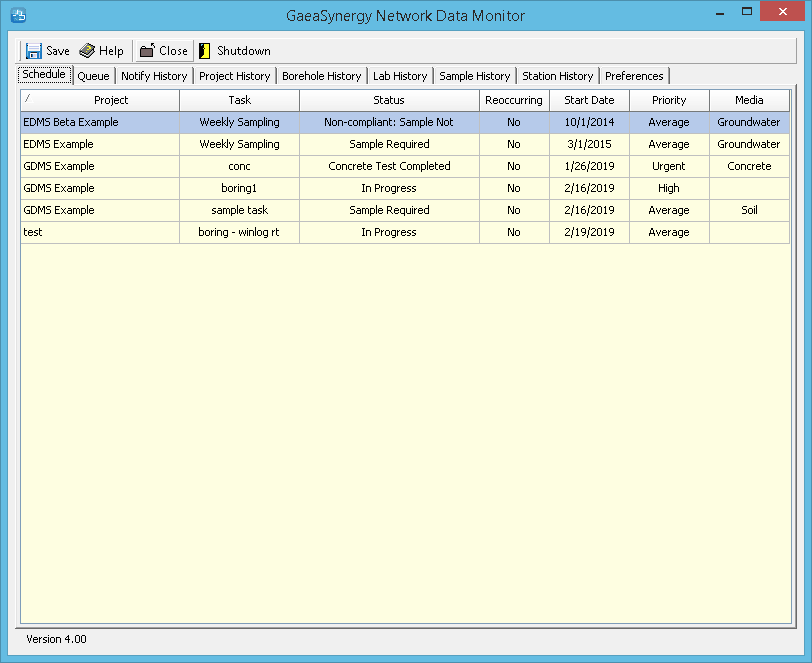
At the top of the form there are buttons for the following:
Save: This button is used to save the current preference settings for use by the service.
Help: This button is used to display help on how to use the program.
Close: This button is used to hide the monitor. The monitor process will still be running in the background and it will have an icon in the taskbar. The popup menu for the icon in the taskbar can be used to show the monitor form and exit the monitor.
Shutdown: This button will close the monitor process. The service is not affected by this and will still be running in the background.
This form has several tabs for Schedule, Queue, Notify History, Project History, Borehole History, Lab History, Sample History, Station History, and Preferences. These tabs are described in the sections below.