|
<< Click to Display Table of Contents >> Deformation vs Time Graph Options |
  
|
|
<< Click to Display Table of Contents >> Deformation vs Time Graph Options |
|
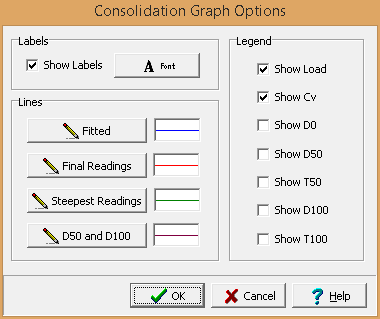
The Deformation vs Time graph has the following options.
Labels
Show Labels: Check this box to show labels for D0, D50, T50, D100, and T100 on the graph.
Font: Click on this button to change the font for the labels.
Lines
Fitted: Click this button to adjust the width, color, and style of the line fitted to the data.
Final Readings: Click this button to adjust the width, color, and style of the straight line fitted to the final readings.
Steepest Readings: Click this button to adjust the width, color, and style of the straight line fitted to the steepest readings.
D50 and D100: Click this button to adjust the width, color, and style of the line drawn to D50, T50 and D100, T100.
Legend
The legend is a box in the graph usually in the top right area that shows results for the load increment.
Show Load: Check this box to show the load in the legend.
Show Cv: Check this box to show the coefficient of consolidation in the legend.
Show D0: Check this box to show the D0 in the legend.
Show D50: Check this box to show the D50 in the legend.
Show T50: Check this box to show the T50 in the legend.
Show D100: Check this box to show the D100 in the legend.
Show T100: Check this box to show the T100 in the legend.