|
<< Click to Display Table of Contents >> Adding a Graph |
  
|
|
<< Click to Display Table of Contents >> Adding a Graph |
|
To add a new graph to a log select Edit > Graph Data > Add Graph Data. The Graph Name form will then be displayed.
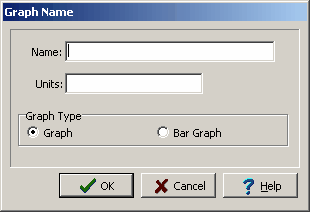
(The appearance of the form will differ slightly depending on if it is WinLoG or WinLoG RT)
To add a new graph specify a unique name, the units, and whether it is a graph or bargraph. The graph will not be displayed on the log unless the template contains a graph column with the same name.