|
<< Click to Display Table of Contents >> Customizing the Multiple Graph and Geophysical Columns |
  
|
|
<< Click to Display Table of Contents >> Customizing the Multiple Graph and Geophysical Columns |
|
Multiple graph and geophysical columns are used to display one or more graphs or geophysical logs in one column. To select the graph or geophysical data to display in the column click on the Customize button on the Columns tab. The Template Graph List form will be displayed.
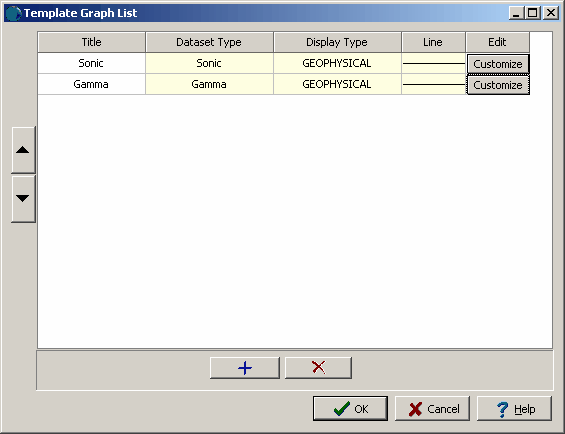
(The appearance of the form will differ slightly depending on if it is WinLoG or WinLoG RT)
This form is used to add and remove the graphs or geophysical logs to display in the column. To add a graph or geophysical log click on the Add button at the bottom. To remove a graph or geophysical log click on the Delete button at the bottom.
After a graph or geophysical log has been added it can be customized by clicking on the Customize button. The customization is the same as for graph data and is described in Customizing a Graph Column.
The order that the graph or geophysical log is displayed in the column can be adjusted using the Up and Down buttons at the left of the form.