|
<< Click to Display Table of Contents >> Filter the Dataset |
  
|
|
<< Click to Display Table of Contents >> Filter the Dataset |
|
This function is used to filter the dataset using the form below.
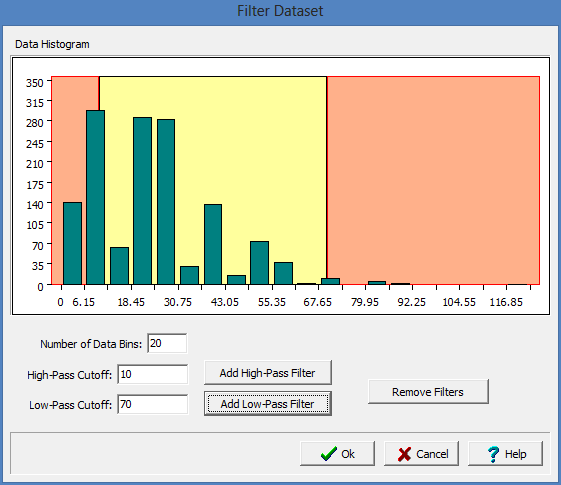
(The appearance of the form will differ slightly depending on if it is WinLoG or WinLoG RT)
The data can be filtered using a high-pass filter, low-pass filter or both. A histogram will be displayed for the data grouping it into bins. The horizontal axis shows the data values and the vertical axis is the number of occurrences of that value.
A high-pass filter will remove all data values below the cutoff value. It is represented by the region in red on the left side of the histogram.
A low-pass filter will remove all data values above the cutoff value. It is represented by the region in red on the right side of the histogram.