|
<< Click to Display Table of Contents >> Graph Macros |
  
|
|
<< Click to Display Table of Contents >> Graph Macros |
|
Graph macros are used to create calculated graph columns from one or more graph or geophysical columns. The calculated column can then be added to a template. When a log is displayed with the template, the calculated column will automatically be generated using the specified calculation. For example, if a log contains to graph or geophysical datasets, A and B, a calculated column could be used to display a graph of A - 2 * B.
To create or edit a graph macro select Tools > Boring/Well > Graph Macros. The Graph Macro form will be displayed. On the left side of this form is a list of existing macros and on the right is the description for the selected macro.
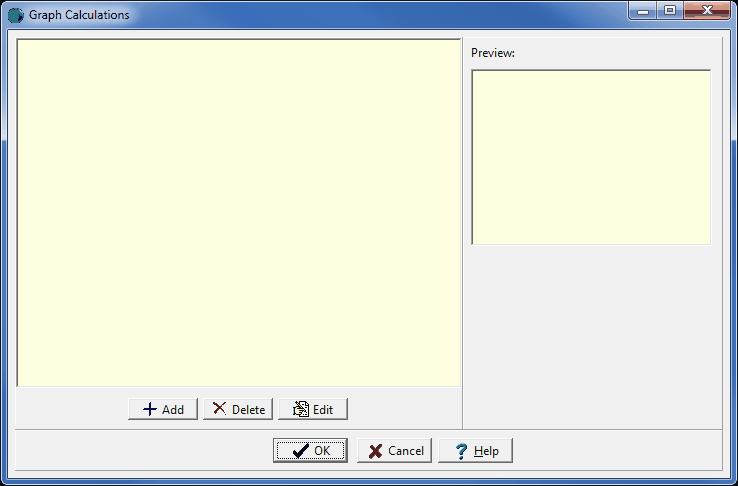
(The appearance of the form will differ slightly depending on if it is WinLoG or WinLoG RT)
Adding a Macro
A new macro can be added using the Add button. The Graph Macro Calculation form will be displayed and can be edited as described in the section below.
Editing a Macro
To edit a macro, select it on the list and click the Edit button. The Graph Macro Calculation form will be displayed and can be edited as described in the section below.
Deleting a Macro
To delete a macro, select it on the list and click the Delete button.