|
<< Click to Display Table of Contents >> Graph Display |
  
|
|
<< Click to Display Table of Contents >> Graph Display |
|
If the Shrinkage Limit data is being displayed as a graph the customize form below will be displayed when the Customize button is clicked. This form is the same as the customize graph form with the addition of the Sample Data tab. The Type, Line, Point, Fill, Scale, and Grid tabs are described in the Customizing a Graph section.
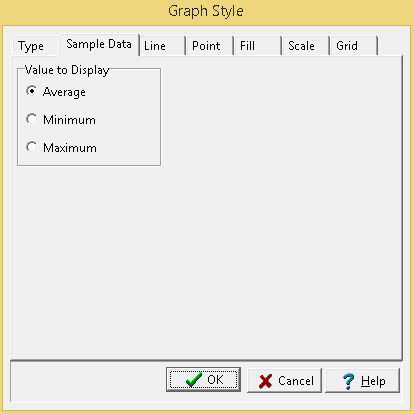
The following can be edited on the Sample Data tab:
Value to Display: If there are multiple values for a sample on a boring or well log, this is used to select what value to display on the log.