|
<< Click to Display Table of Contents >> Data Tab |
  
|
|
<< Click to Display Table of Contents >> Data Tab |
|
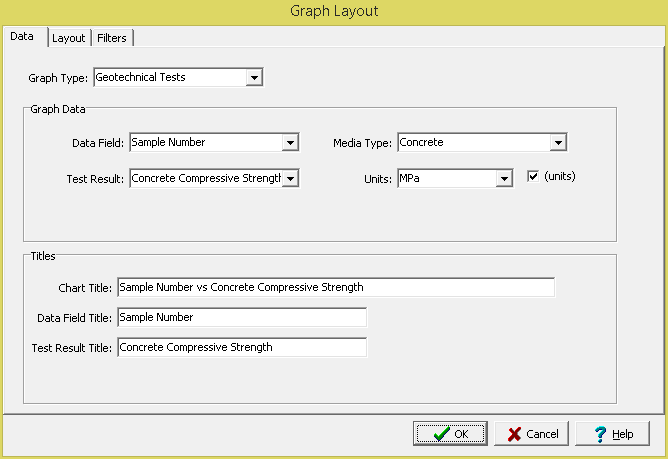
This tab is used to specify the table type, data and titles to show in the graph.
Graph Type: This is used to select the type of data to display in the graph. The can be data from geotechnical tests, lab analyses, or water levels.
Data Type: If the graph type is Water Levels, this is used to select the types of data to display (either all, samples, or wells).
Data Field: This is used to select the data field (bottom axis) to display in the graph. The types of data that can be selected will depend on the graph type.
Media Type: If the graph type is Geotechnical Tests, this is used to select the media type (either asphalt, concrete, rock, soil & aggregates).
Test Result: If the graph type is Geotechnical Tests, this is used to select the type of result (vertical axis) to display in the graph.
Matrix: If the graph type is Lab Analyses, this is used to select the matrix for the analyses (either air, fluid, gas, rock, soil, solid, water).
Parameter Group: If the graph type is Lab Analyses, this is used to select the parameter group for the analyses.
Parameter: If the graph type is Lab Analyses, this is used to select the parameter (vertical axis) within the parameter group to display on the graph.
Water Level: If the graph type is Water Levels, this is used to select the water levels to display on the graph. The water levels to display for each well can be All, Most Recent, First, Average, Minimum, or Maximum.
Display: If the graph type is Water Levels, this is used to select whether to display depths or elevations for the water levels.