|
<< Click to Display Table of Contents >> Regulations Tab |
  
|
|
<< Click to Display Table of Contents >> Regulations Tab |
|
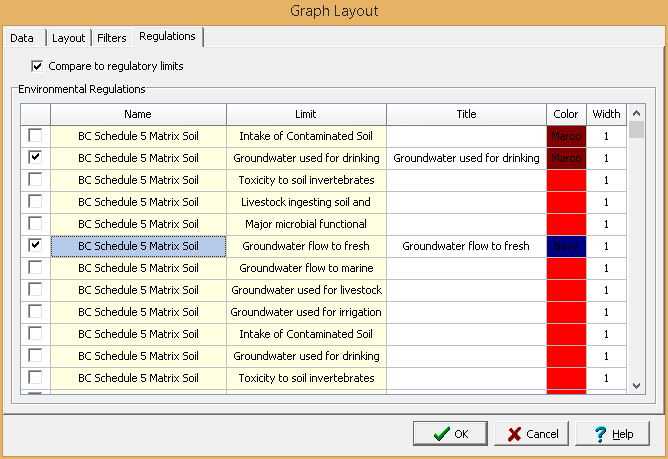
This tab is used to select the regulatory limits to show for Lab Analyses graphs. These limits are displayed as horizontal lines on the graph.
Compare to regulatory limits: Check this box to show the regulatory limits for the lab analyses parameters.
Regulatory Limits: Check the boxes next to the regulatory limits to display in the table. The regulatory limits that can be selected will depend on the matrix type selected on the Data tab.
Regulation Titles: The following information can be displayed for the regulations:
Regulation Title: This is the title for the regulation column or row.
Color: This is used to select the color to use for the regulation line.
Width: This is used to select the width of the regulation line.