|
<< Click to Display Table of Contents >> Data Entry |
  
|
|
<< Click to Display Table of Contents >> Data Entry |
|
Open the Examples project and open Case 11.
General Tab
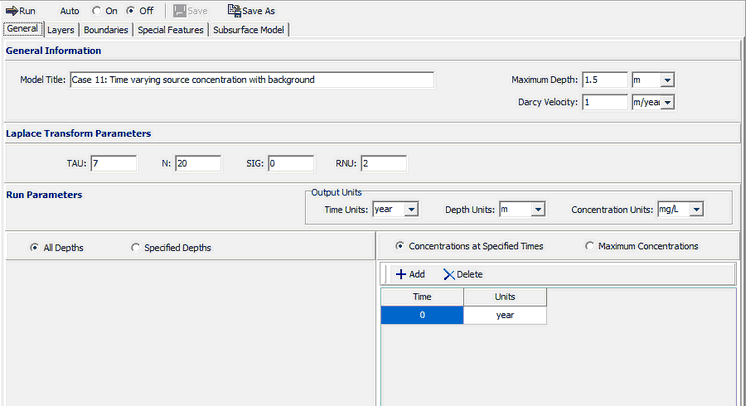
In the General tab the Darcy velocity can not be specified if the Time-varying Properties special feature is used. Any Darcy velocity entered will be ignored. When the time-varying properties special feature is used the times to calculate the concentrations are specified in the Time-Varying Properties sub-tab of the Special Features tab..
Layers Tab
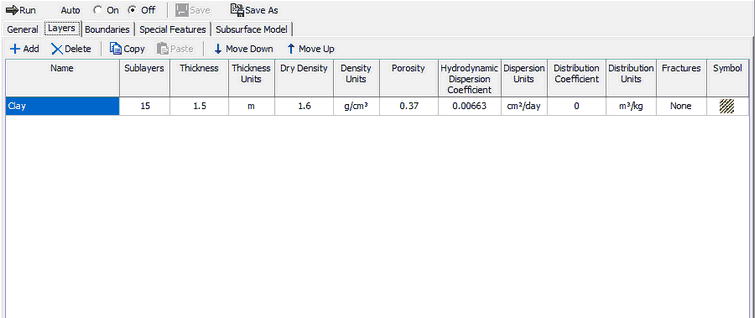
The layer data for the layer can be specified on the Layers tab. Although the clay layer is assumed to be infinite, the concentrations for only the top 1.5 m will be calculated. This is the depth interval where the contaminant plume is expected.
Boundaries Tab
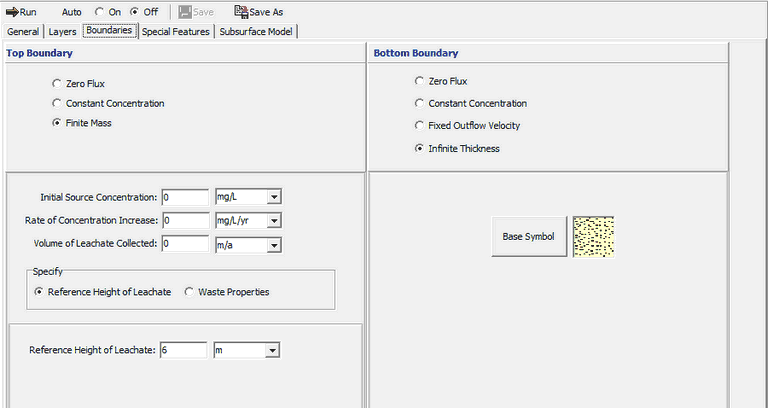
In this example, the top boundary has a finite mass and the bottom boundary is represented by a layer of infinite thickness. If the Time-varying Properties special feature has been selected, any parameters entered for the Finite Mass tab will be ignored and the will be entered in the Time-Varying Properties sub-tab of the Special Features tab.
Special Features
The initial concentration profile and time-varying properties for this example are specified using the Special Features tab.
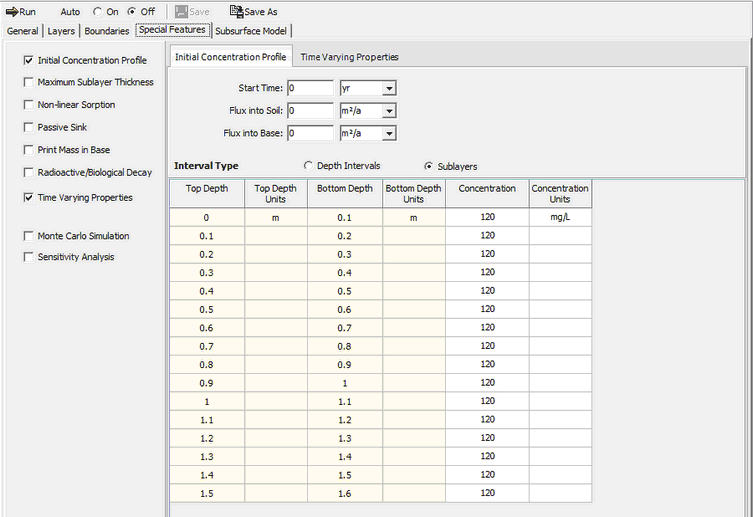
Initial Concentration Profile
To specify the initial concentration profile, check the Initial Concentration Profile box on the Special Features tab. The Concentration Profile sub-tab can be used to specify the type of profile as either Depth Intervals or Sublayers. The concentration profile can be specified as a constant for given depth intervals or as a different value for every sublayer. In this example the background concentration is uniform with depth, and can be specified as a constant 120 mg/L over 1 depth interval.
Time Varying Properties
To specify the time-varying properties, check the Time-Varying Properties box on the Special Features tab. The Time-Varying Data sub-tab can be used to the time periods and whether there are variable layer properties and variable decay. In this example there are 5 time periods viz. 0 to 7 years, 7 to 10 years, 10 to 13 years, 13 to 15 years, and 15 to 19 years.
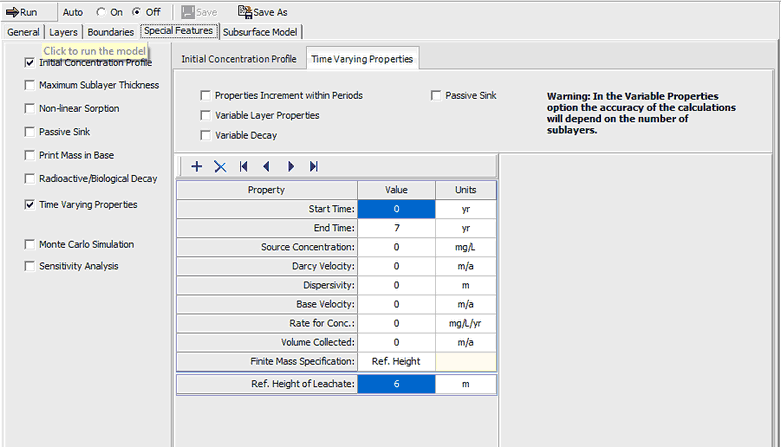
In the first time period, specifying only one time increment means that the concentrations will only be calculated at the end time (i.e., 7 years).The beginning source concentration is zero, since fresh water is initially filling the cell.
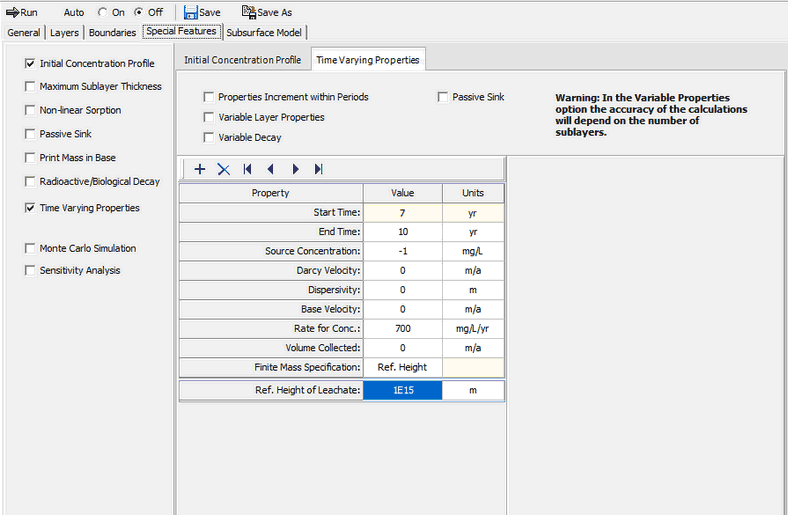
The data for time period two can be specified by clicking on the Next button. This time period is from 7 to 10 years. Between the years 7 and 10 the source concentration increases linearly with time at a rate of 700 mg/L per year. Only one time increment is necessary, since we are not interested in calculating the concentrations at any intermediate times. Specifying the source concentration as -1 causes the calculated concentration at the end of the previous period to be used as the concentration at the beginning of this period. The Leachate Reference Height is set very high in order to ignore the effects of source depletion.
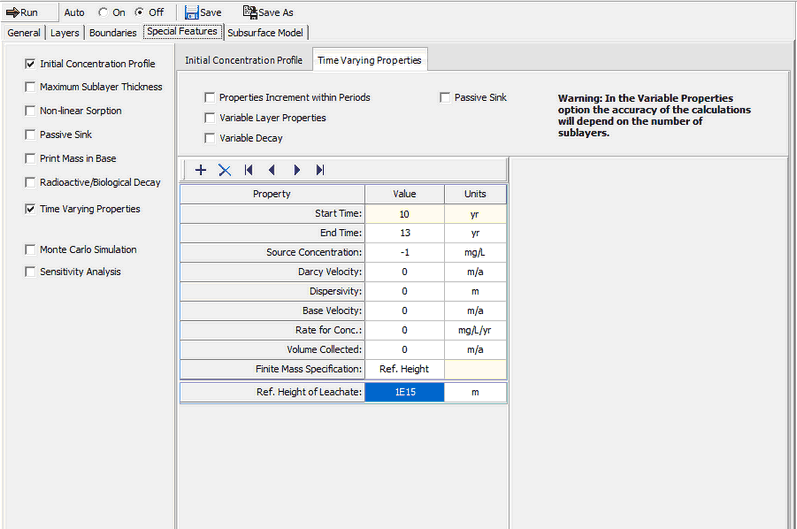
Next the data for time period three should be entered, this time period is from 10 to 13 years. During the 3 years between 10 and 13 years the source concentration remains constant. Specifying the beginning concentration as -1 indicates to use the calculated concentration at the end of the previous time period as the concentration at the start of this time period. The Leachate Reference Height is set very high in order to ignore the effects of source depletion.
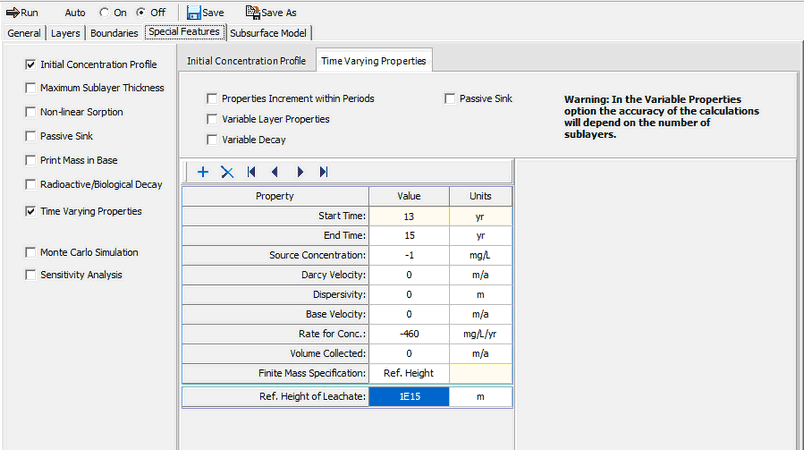
Next the data for time period four should be entered, this time period is from 13 to 15 years. Between the years 13 and 15 the source concentration decreases linearly with time at the rate of 460 mg/L per year. Specifying the beginning concentration as -1 indicates to use the calculated concentration at the end of the previous time period as the concentration at the start of this time period. The Leachate Reference Height is set very high in order to ignore the effects of source depletion.
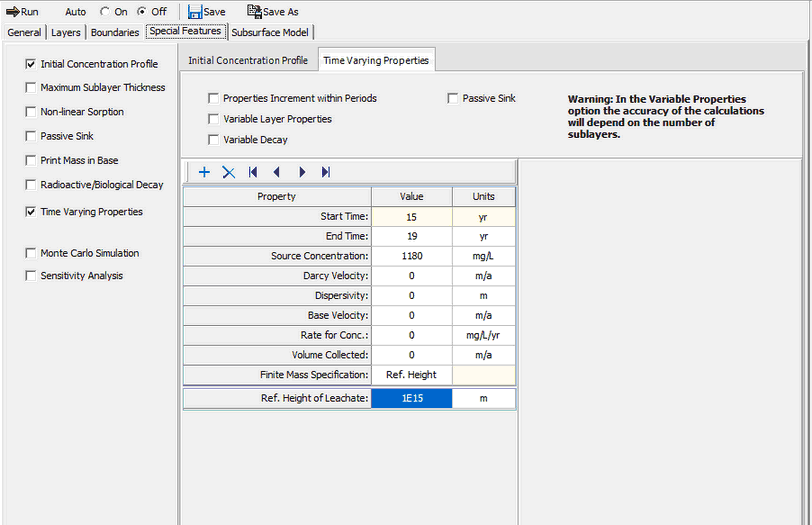
Data for the last time period can be entered by clicking on the Next button, this time period is from 15 to 19 years. For the 4 years between 15 and 19 the source concentration is assumed to remain constant at 1180 mg/L. The Leachate Reference Height is set very high in order to ignore the effects of depletion of the source.