|
<< Click to Display Table of Contents >> Model Output |
  
|
|
<< Click to Display Table of Contents >> Model Output |
|
After the model has been executed, the output for the model will be displayed.
Output Comparison
The results given by analytical solution can be compared to the output by creating a new imported dataset using File > New > Imported Dataset.
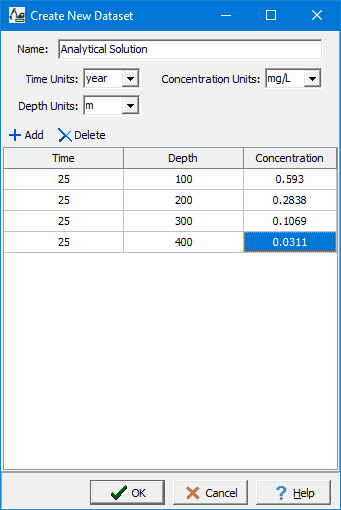
The calculated concentrations from the POLLUTE program and the analytical solution by Tang et al. (1981) are listed below. Both solutions give identical results.
Depth |
POLLUTE |
Analytical Solution |
(m) |
(mg/L) |
(mg/L) |
100 |
0.593 |
0.593 |
200 |
0.2838 |
0.2838 |
300 |
0.1069 |
0.1069 |
400 |
0.0311 |
0.0311 |
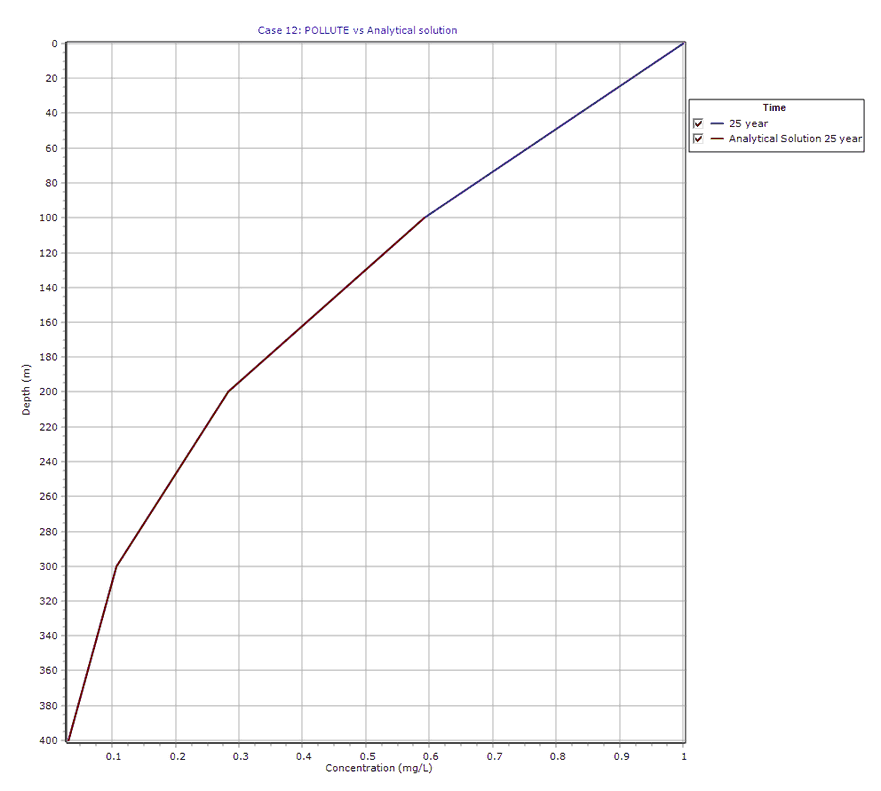
Depth vs Concentration
The Depth vs Concentration chart can be displayed by selecting the Depth vs Concentration item for the Chart Type.
Output Listing
To display the output as a text listing that will show the calculated concentrations as numbers, click on the List tab.
POLLUTEv8
Version 8.00 Beta
Copyright (c) 2021
GAEA Technologies Ltd., R.K. Rowe and J.R. Booker
Case 12: POLLUTE vs Analytical solution
THE DARCY VELOCITY (Flux) THROUGH THE LAYERS Va = 0.0073 m/year
Layer Properties
Layer |
Fracture |
Opening |
Number |
Fracture |
Opening |
Number |
Fracture |
Opening |
Number |
Soil |
1 m |
1E-5 m |
10 |
|
|
|
|
|
|
Layer |
Dispersion Coefficient in Fractures |
Distribution Coefficient in Fractures |
Fracture Porosity |
Retardation Coefficient in Matrix |
Soil |
0.077 m²/a |
0 m³/kg |
1.0000E-05 |
1.0000E+00 |
Layer |
Thickness |
Number of Sublayers |
Coefficient of Hydrodynamic Dispersion |
Matrix Porosity |
Distributon Coefficient |
Dry Density |
Soil |
400 m |
4 |
7.569E-6 m²/a |
0.05 |
0 m³/kg |
0 g/cm³ |
Boundary Conditions
Constant Concentration
Source Concentration = 1 mg/L
Infinite Thickness Bottom Boundary
Laplace Transform Parameters
TAU = 7 N = 20 SIG = 0 RNU = 2
Calculated Concentrations at Selected Times and Depths
Time |
Depth |
Concentration |
25 |
0.000E+00 |
1.000E+00 |
|
1.000E+02 |
5.930E-01 |
|
2.000E+02 |
2.838E-01 |
|
3.000E+02 |
1.069E-01 |
|
4.000E+02 |
3.111E-02 |
NOTICE
Although this program has been tested and experience would indicate that it is accurate within the limits given by the assumptions of the theory used, we make no warranty as to workability of this software or any other licensed material. No warranties either expressed or implied (including warranties of fitness) shall apply. No responsibility is assumed for any errors, mistakes or misrepresentations that may occur from the use of this computer program. The user accepts full responsibility for assessing the validity and applicability of the results obtained with this program for any specific case.