|
<< Click to Display Table of Contents >> Model Output |
  
|
|
<< Click to Display Table of Contents >> Model Output |
|
After the model has been executed, the output for the model will be displayed.
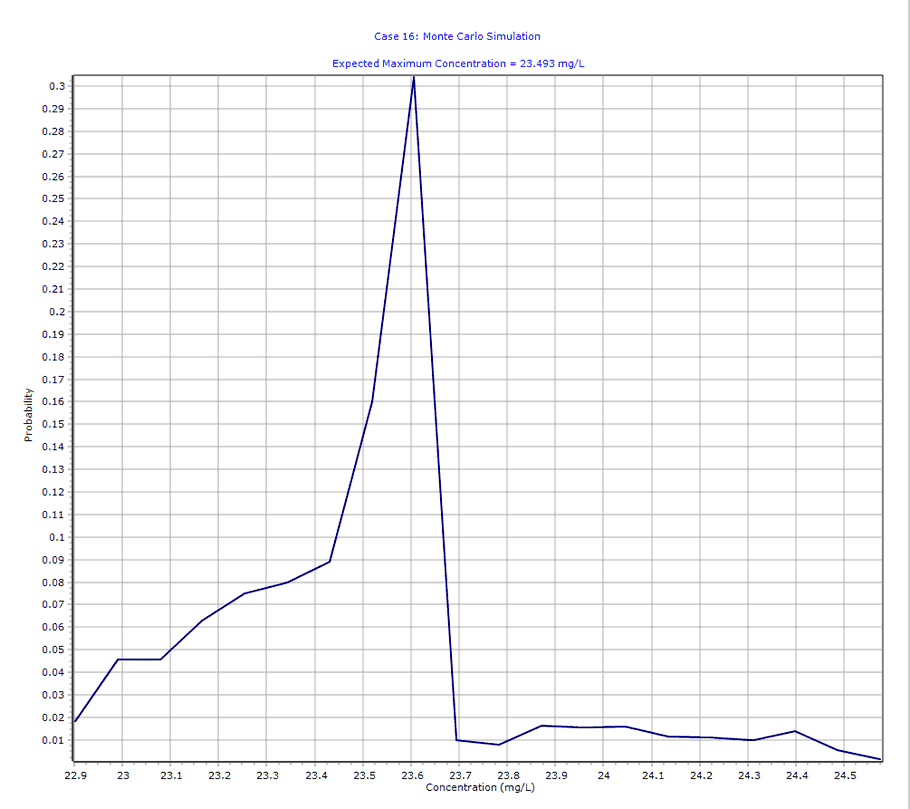
Probability vs Concentration
The Probability vs Concentration chart can be displayed by selecting the Probability vs Concentration item for the Chart Type. Using the chart of the probability of peak chloride concentration predictions can be made about the concentration in the aquifer. For example, in this case, the expected maximum concentration is 23.493 mg/L.
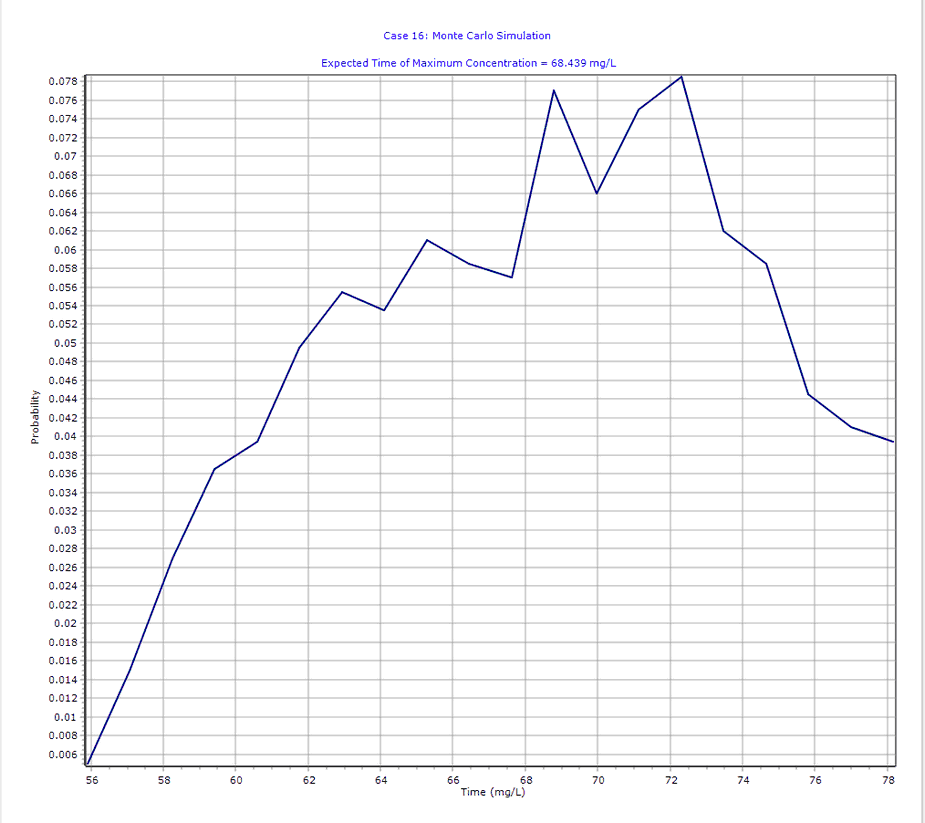
Probability vs Time
The Probability vs Time chart can be displayed by selecting the Probability vs Time item for the Chart Type. Using this chart the expected time of the maximum concentration can be predicted. In this example, the expected time is 68.439 years.
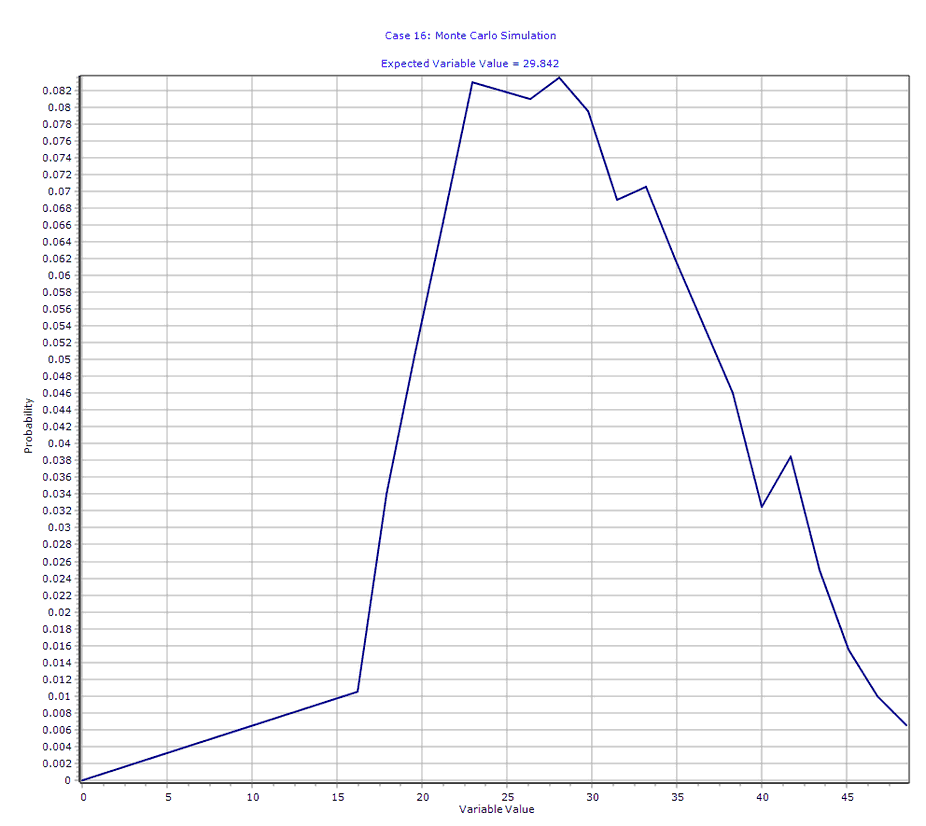
Probability vs Variable Value
The Probability vs Variable Value chart can be displayed by selecting the Probability vs Variable Value item for the Chart Type. Using this chart the distribution of the variable can be checked against the distribution that was specified. In this example, the specified distribution was a triangular distribution with a minimum of 15, mode of 25 and maximum of 50.
Output Listing
To display the output as a text listing that will show the calculated concentrations as numbers, click on the List tab.
POLLUTEv8
Version 8.00 Beta
Copyright (c) 2021
GAEA Technologies Ltd., R.K. Rowe and J.R. Booker
Case 16: Monte Carlo Simulation
THE VARIABLE VELOCITY AND/OR CONCENTRATION OPTION HAS BEEN USED. NOTE THAT THE ACCURACY OF THE CALCULATIONS WITH THIS OPTION WILL DEPEND ON THE NUMBER OF SUBLAYERS USED.
THE PASSIVE SINK OPTION HAS BEEN USED. NOTE THE USER IS RESPONSIBLE FOR ENSURING THAT VELOCITY CHANGES ARE CONSISTENT WITH THE PASSIVE SINK.
Layer Properties
Layer |
Thickness |
Number of Sublayers |
Coefficient of Hydrodynamic Dispersion |
Matrix Porosity |
Distributon Coefficient |
Dry Density |
Clay |
1 m |
4 |
0.02 m²/a |
0.4 |
0 cm³/g |
1.5 g/cm³ |
Collection System |
0.3 m |
4 |
10 m²/a |
0.3 |
0 cm³/g |
1.5 g/cm³ |
Aquitard |
2 m |
4 |
0.02 m²/a |
0.4 |
0 cm³/g |
1.5 g/cm³ |
Boundary Conditions
Finite Mass Top Boundary
Fixed Outflow Bottom Boundary
Landfill Length = 200 m
Landfill Width = 1 m
Base Thickness = 1 m
Base Porosity = 0.3
Variation in Properties with Time
Time Periods with the same Source and Velocity
Period |
Start Time |
No. of |
Time Step |
Source Conc |
Rate of Change |
Height of Leachate |
Volume Collected |
1 |
0 yr |
1 |
20 yr |
1000 mg/L |
0 |
7.5 m |
0.29 m/a |
2 |
20 yr |
5 |
2 yr |
-1 mg/L |
0 |
7.5 m |
0.2 m/a |
3 |
30 yr |
2 |
10 yr |
-1 mg/L |
0 |
7.5 m |
0.2 m/a |
4 |
50 yr |
5 |
10 yr |
-1 mg/L |
0 |
7.5 m |
0.2 m/a |
5 |
100 yr |
5 |
20 yr |
-1 mg/L |
0 |
7.5 m |
0.2 m/a |
Period |
Start Time |
End Time |
Proportion Mass |
Dispersivity |
Base Velocity |
1 |
0 yr |
20 yr |
1 m/a |
0.4 m |
4 m/a |
2 |
20 yr |
30 yr |
1 m/a |
0.4 m |
4 m/a |
3 |
30 yr |
50 yr |
1 m/a |
0.4 m |
4 m/a |
4 |
50 yr |
100 yr |
1 m/a |
0.4 m |
4 m/a |
5 |
100 yr |
200 yr |
1 m/a |
0.4 m |
4 m/a |
Velocity and Sink Profile
Time Period |
Minimum Depth |
Maximum Depth |
Vertical Velocity |
Horizontal Outflow |
1 / 1 |
0 m |
1 m |
0.01 m/a |
0 m/a |
|
1 m |
1.3 m |
0.01 m/a |
6.67 m/a |
|
1.3 m |
3.3 m |
0 m/a |
0 m/a |
2 / 1 |
0 m |
1 m |
0.028 m/a |
0 m/a |
|
1 m |
1.3 m |
0.028 m/a |
18.7 m/a |
|
1.3 m |
3.3 m |
0 m/a |
0 m/a |
2 / 2 |
0 m |
1 m |
0.046 m/a |
0 m/a |
|
1 m |
1.3 m |
0.046 m/a |
30.7 m/a |
|
1.3 m |
3.3 m |
0 m/a |
0 m/a |
2 / 3 |
0 m |
1 m |
0.064 m/a |
0 m/a |
|
1 m |
1.3 m |
0.064 m/a |
42.7 m/a |
|
1.3 m |
3.3 m |
0 m/a |
0 m/a |
2 / 4 |
0 m |
1 m |
0.082 m/a |
0 m/a |
|
1 m |
1.3 m |
0.082 m/a |
54.7 m/a |
|
1.3 m |
3.3 m |
0 m/a |
0 m/a |
2 / 5 |
0 m |
1 m |
0.1 m/a |
0 m/a |
|
1 m |
1.3 m |
0.1 m/a |
66.7 m/a |
|
1.3 m |
3.3 m |
0 m/a |
0 m/a |
3 / 1 |
0 m |
1 m |
0.1 m/a |
0 m/a |
|
1 m |
1.3 m |
0.1 m/a |
66.7 m/a |
|
1.3 m |
3.3 m |
0 m/a |
0 m/a |
3 / 2 |
0 m |
1 m |
0.1 m/a |
0 m/a |
|
1 m |
1.3 m |
0.1 m/a |
66.7 m/a |
|
1.3 m |
3.3 m |
0 m/a |
0 m/a |
4 / 1 |
0 m |
1 m |
0.1 m/a |
0 m/a |
|
1 m |
1.3 m |
0.1 m/a |
66.7 m/a |
|
1.3 m |
3.3 m |
0 m/a |
0 m/a |
4 / 2 |
0 m |
1 m |
0.1 m/a |
0 m/a |
|
1 m |
1.3 m |
0.1 m/a |
66.7 m/a |
|
1.3 m |
3.3 m |
0 m/a |
0 m/a |
4 / 3 |
0 m |
1 m |
0.1 m/a |
0 m/a |
|
1 m |
1.3 m |
0.1 m/a |
66.7 m/a |
|
1.3 m |
3.3 m |
0 m/a |
0 m/a |
4 / 4 |
0 m |
1 m |
0.1 m/a |
0 m/a |
|
1 m |
1.3 m |
0.1 m/a |
66.7 m/a |
|
1.3 m |
3.3 m |
0 m/a |
0 m/a |
4 / 5 |
0 m |
1 m |
0.1 m/a |
0 m/a |
|
1 m |
1.3 m |
0.1 m/a |
66.7 m/a |
|
1.3 m |
3.3 m |
0 m/a |
0 m/a |
5 / 1 |
0 m |
1 m |
0.1 m/a |
0 m/a |
|
1 m |
1.3 m |
0.1 m/a |
66.7 m/a |
|
1.3 m |
3.3 m |
0 m/a |
0 m/a |
5 / 2 |
0 m |
1 m |
0.1 m/a |
0 m/a |
|
1 m |
1.3 m |
0.1 m/a |
66.7 m/a |
|
1.3 m |
3.3 m |
0 m/a |
0 m/a |
5 / 3 |
0 m |
1 m |
0.1 m/a |
0 m/a |
|
1 m |
1.3 m |
0.1 m/a |
66.7 m/a |
|
1.3 m |
3.3 m |
0 m/a |
0 m/a |
5 / 4 |
0 m |
1 m |
0.1 m/a |
0 m/a |
|
1 m |
1.3 m |
0.1 m/a |
66.7 m/a |
|
1.3 m |
3.3 m |
0 m/a |
0 m/a |
5 / 5 |
0 m |
1 m |
0.1 m/a |
0 m/a |
|
1 m |
1.3 m |
0.1 m/a |
66.7 m/a |
|
1.3 m |
3.3 m |
0 m/a |
0 m/a |
Laplace Transform Parameters
TAU = 7 N = 20 SIG = 0 RNU = 2
Monte Carlo Simulation Results
Number of Simulations = 2000
Number of Variables = 1
Number of Data Ranges = 20
Variable # 1
Variable Properties End Time
Time Period = 1
Triangular Distribution ( Minimum = 15 Maximum = 50 Mode = 25 )
NOTICE
Although this program has been tested and experience would indicate that it is accurate within the limits given by the assumptions of the theory used, we make no warranty as to workability of this software or any other licensed material. No warranties either expressed or implied (including warranties of fitness) shall apply. No responsibility is assumed for any errors, mistakes or misrepresentations that may occur from the use of this computer program. The user accepts full responsibility for assessing the validity and applicability of the results obtained with this program for any specific case.
Layer |
Thickness |
Number of Sublayers |
Coefficient of Hydrodynamic Dispersion |
Matrix Porosity |
Distributon Coefficient |
Dry Density |
Clay |
1 m |
4 |
0.02 m²/a |
0.4 |
0 cm³/g |
1.5 g/cm³ |
Collection System |
0.3 m |
4 |
10 m²/a |
0.3 |
0 cm³/g |
1.5 g/cm³ |
Aquitard |
2 m |
4 |
0.02 m²/a |
0.4 |
0 cm³/g |
1.5 g/cm³ |
Boundary Conditions
Finite Mass Top Boundary
Fixed Outflow Bottom Boundary
Landfill Length = 200 m
Landfill Width = 1 m
Base Thickness = 1 m
Base Porosity = 0.3
Variation in Properties with Time
Time Periods with the same Source and Velocity
Period |
Start Time |
No. of |
Time Step |
Source Conc |
Rate of Change |
Height of Leachate |
Volume Collected |
1 |
0 yr |
1 |
20 yr |
1000 mg/L |
0 |
7.5 m |
0.29 m/a |
2 |
20 yr |
5 |
2 yr |
-1 mg/L |
0 |
7.5 m |
0.2 m/a |
3 |
30 yr |
2 |
10 yr |
-1 mg/L |
0 |
7.5 m |
0.2 m/a |
4 |
50 yr |
5 |
10 yr |
-1 mg/L |
0 |
7.5 m |
0.2 m/a |
5 |
100 yr |
5 |
20 yr |
-1 mg/L |
0 |
7.5 m |
0.2 m/a |
Period |
Start Time |
End Time |
Proportion Mass |
Dispersivity |
Base Velocity |
1 |
0 yr |
20 yr |
1 m/a |
0.4 m |
4 m/a |
2 |
20 yr |
30 yr |
1 m/a |
0.4 m |
4 m/a |
3 |
30 yr |
50 yr |
1 m/a |
0.4 m |
4 m/a |
4 |
50 yr |
100 yr |
1 m/a |
0.4 m |
4 m/a |
5 |
100 yr |
200 yr |
1 m/a |
0.4 m |
4 m/a |
Velocity and Sink Profile
Time Period |
Minimum Depth |
Maximum Depth |
Vertical Velocity |
Horizontal Outflow |
1 / 1 |
0 m |
1 m |
0.01 m/a |
0 m/a |
|
1 m |
1.3 m |
0.01 m/a |
6.67 m/a |
|
1.3 m |
3.3 m |
0 m/a |
0 m/a |
2 / 1 |
0 m |
1 m |
0.028 m/a |
0 m/a |
|
1 m |
1.3 m |
0.028 m/a |
18.7 m/a |
|
1.3 m |
3.3 m |
0 m/a |
0 m/a |
2 / 2 |
0 m |
1 m |
0.046 m/a |
0 m/a |
|
1 m |
1.3 m |
0.046 m/a |
30.7 m/a |
|
1.3 m |
3.3 m |
0 m/a |
0 m/a |
2 / 3 |
0 m |
1 m |
0.064 m/a |
0 m/a |
|
1 m |
1.3 m |
0.064 m/a |
42.7 m/a |
|
1.3 m |
3.3 m |
0 m/a |
0 m/a |
2 / 4 |
0 m |
1 m |
0.082 m/a |
0 m/a |
|
1 m |
1.3 m |
0.082 m/a |
54.7 m/a |
|
1.3 m |
3.3 m |
0 m/a |
0 m/a |
2 / 5 |
0 m |
1 m |
0.1 m/a |
0 m/a |
|
1 m |
1.3 m |
0.1 m/a |
66.7 m/a |
|
1.3 m |
3.3 m |
0 m/a |
0 m/a |
3 / 1 |
0 m |
1 m |
0.1 m/a |
0 m/a |
|
1 m |
1.3 m |
0.1 m/a |
66.7 m/a |
|
1.3 m |
3.3 m |
0 m/a |
0 m/a |
3 / 2 |
0 m |
1 m |
0.1 m/a |
0 m/a |
|
1 m |
1.3 m |
0.1 m/a |
66.7 m/a |
|
1.3 m |
3.3 m |
0 m/a |
0 m/a |
4 / 1 |
0 m |
1 m |
0.1 m/a |
0 m/a |
|
1 m |
1.3 m |
0.1 m/a |
66.7 m/a |
|
1.3 m |
3.3 m |
0 m/a |
0 m/a |
4 / 2 |
0 m |
1 m |
0.1 m/a |
0 m/a |
|
1 m |
1.3 m |
0.1 m/a |
66.7 m/a |
|
1.3 m |
3.3 m |
0 m/a |
0 m/a |
4 / 3 |
0 m |
1 m |
0.1 m/a |
0 m/a |
|
1 m |
1.3 m |
0.1 m/a |
66.7 m/a |
|
1.3 m |
3.3 m |
0 m/a |
0 m/a |
4 / 4 |
0 m |
1 m |
0.1 m/a |
0 m/a |
|
1 m |
1.3 m |
0.1 m/a |
66.7 m/a |
|
1.3 m |
3.3 m |
0 m/a |
0 m/a |
4 / 5 |
0 m |
1 m |
0.1 m/a |
0 m/a |
|
1 m |
1.3 m |
0.1 m/a |
66.7 m/a |
|
1.3 m |
3.3 m |
0 m/a |
0 m/a |
5 / 1 |
0 m |
1 m |
0.1 m/a |
0 m/a |
|
1 m |
1.3 m |
0.1 m/a |
66.7 m/a |
|
1.3 m |
3.3 m |
0 m/a |
0 m/a |
5 / 2 |
0 m |
1 m |
0.1 m/a |
0 m/a |
|
1 m |
1.3 m |
0.1 m/a |
66.7 m/a |
|
1.3 m |
3.3 m |
0 m/a |
0 m/a |
5 / 3 |
0 m |
1 m |
0.1 m/a |
0 m/a |
|
1 m |
1.3 m |
0.1 m/a |
66.7 m/a |
|
1.3 m |
3.3 m |
0 m/a |
0 m/a |
5 / 4 |
0 m |
1 m |
0.1 m/a |
0 m/a |
|
1 m |
1.3 m |
0.1 m/a |
66.7 m/a |
|
1.3 m |
3.3 m |
0 m/a |
0 m/a |
5 / 5 |
0 m |
1 m |
0.1 m/a |
0 m/a |
|
1 m |
1.3 m |
0.1 m/a |
66.7 m/a |
|
1.3 m |
3.3 m |
0 m/a |
0 m/a |
Laplace Transform Parameters
TAU = 7 N = 20 SIG = 0 RNU = 2
Monte Carlo Simulation Results
Number of Simulations = 2000
Number of Variables = 1
Number of Data Ranges = 20
Variable # 1
Variable Properties End Time
Time Period = 1
Triangular Distribution ( Minimum = 15 Maximum = 50 Mode = 25 )
Depth = 3.3
DISTRIBUTION OF PEAK CONCENTRATION
Minimum |
Maximum |
Number |
Probability |
Cumulative |
Expected |
2.286E+01 |
2.295E+01 |
37 |
0.02 |
0.02 |
4.237E-01 |
2.295E+01 |
2.303E+01 |
91 |
0.05 |
0.06 |
1.046E+00 |
2.303E+01 |
2.312E+01 |
91 |
0.05 |
0.11 |
1.050E+00 |
2.312E+01 |
2.321E+01 |
126 |
0.06 |
0.17 |
1.459E+00 |
2.321E+01 |
2.330E+01 |
150 |
0.07 |
0.25 |
1.744E+00 |
2.330E+01 |
2.339E+01 |
160 |
0.08 |
0.33 |
1.867E+00 |
2.339E+01 |
2.347E+01 |
178 |
0.09 |
0.42 |
2.085E+00 |
2.347E+01 |
2.356E+01 |
320 |
0.16 |
0.58 |
3.763E+00 |
2.356E+01 |
2.365E+01 |
608 |
0.30 |
0.88 |
7.176E+00 |
2.365E+01 |
2.374E+01 |
20 |
0.01 |
0.89 |
2.369E-01 |
2.374E+01 |
2.383E+01 |
16 |
0.01 |
0.90 |
1.903E-01 |
2.383E+01 |
2.391E+01 |
33 |
0.02 |
0.92 |
3.939E-01 |
2.391E+01 |
2.400E+01 |
31 |
0.02 |
0.93 |
3.714E-01 |
2.400E+01 |
2.409E+01 |
32 |
0.02 |
0.95 |
3.847E-01 |
2.409E+01 |
2.418E+01 |
23 |
0.01 |
0.96 |
2.776E-01 |
2.418E+01 |
2.427E+01 |
22 |
0.01 |
0.97 |
2.665E-01 |
2.427E+01 |
2.436E+01 |
20 |
0.01 |
0.98 |
2.431E-01 |
2.436E+01 |
2.444E+01 |
28 |
0.01 |
0.99 |
3.416E-01 |
2.444E+01 |
2.453E+01 |
11 |
0.01 |
1.00 |
1.347E-01 |
2.453E+01 |
2.462E+01 |
3 |
0.00 |
1.00 |
3.686E-02 |
Expected Maximum Concentration = 2.349E+01
DISTRIBUTION OF TIME OF PEAK CONCENTRATION
Minimum |
Maximum |
Number |
Probability |
Cumulative |
Expected |
5.532E+01 |
5.650E+01 |
10 |
0.01 |
0.01 |
2.795E-01 |
5.650E+01 |
5.767E+01 |
30 |
0.01 |
0.02 |
8.562E-01 |
5.767E+01 |
5.884E+01 |
54 |
0.03 |
0.05 |
1.573E+00 |
5.884E+01 |
6.001E+01 |
73 |
0.04 |
0.08 |
2.169E+00 |
6.001E+01 |
6.118E+01 |
79 |
0.04 |
0.12 |
2.393E+00 |
6.118E+01 |
6.235E+01 |
99 |
0.05 |
0.17 |
3.057E+00 |
6.235E+01 |
6.352E+01 |
111 |
0.06 |
0.23 |
3.493E+00 |
6.352E+01 |
6.469E+01 |
107 |
0.05 |
0.28 |
3.430E+00 |
6.469E+01 |
6.586E+01 |
122 |
0.06 |
0.34 |
3.982E+00 |
6.586E+01 |
6.703E+01 |
117 |
0.06 |
0.40 |
3.887E+00 |
6.703E+01 |
6.820E+01 |
114 |
0.06 |
0.46 |
3.854E+00 |
6.820E+01 |
6.938E+01 |
154 |
0.08 |
0.53 |
5.297E+00 |
6.938E+01 |
7.055E+01 |
132 |
0.07 |
0.60 |
4.617E+00 |
7.055E+01 |
7.172E+01 |
150 |
0.07 |
0.68 |
5.335E+00 |
7.172E+01 |
7.289E+01 |
157 |
0.08 |
0.75 |
5.676E+00 |
7.289E+01 |
7.406E+01 |
124 |
0.06 |
0.82 |
4.555E+00 |
7.406E+01 |
7.523E+01 |
117 |
0.06 |
0.88 |
4.367E+00 |
7.523E+01 |
7.640E+01 |
89 |
0.04 |
0.92 |
3.374E+00 |
7.640E+01 |
7.757E+01 |
82 |
0.04 |
0.96 |
3.156E+00 |
7.757E+01 |
7.874E+01 |
79 |
0.04 |
1.00 |
3.087E+00 |
Expected Time of Maximum Concentration = 68.4391550021306
VARIABLE NUMBER: 1
Minimum |
Maximum |
Number |
Probability |
Cumulative |
Expected |
1.532E+01 |
1.702E+01 |
21 |
0.01 |
0.01 |
1.698E-01 |
1.702E+01 |
1.873E+01 |
68 |
0.03 |
0.04 |
6.078E-01 |
1.873E+01 |
2.043E+01 |
101 |
0.05 |
0.10 |
9.886E-01 |
2.043E+01 |
2.213E+01 |
133 |
0.07 |
0.16 |
1.415E+00 |
2.213E+01 |
2.383E+01 |
166 |
0.08 |
0.24 |
1.907E+00 |
2.383E+01 |
2.553E+01 |
164 |
0.08 |
0.33 |
2.024E+00 |
2.553E+01 |
2.723E+01 |
162 |
0.08 |
0.41 |
2.137E+00 |
2.723E+01 |
2.893E+01 |
167 |
0.08 |
0.49 |
2.345E+00 |
2.893E+01 |
3.063E+01 |
159 |
0.08 |
0.57 |
2.368E+00 |
3.063E+01 |
3.233E+01 |
138 |
0.07 |
0.64 |
2.172E+00 |
3.233E+01 |
3.403E+01 |
141 |
0.07 |
0.71 |
2.339E+00 |
3.403E+01 |
3.573E+01 |
124 |
0.06 |
0.77 |
2.163E+00 |
3.573E+01 |
3.743E+01 |
108 |
0.05 |
0.83 |
1.975E+00 |
3.743E+01 |
3.913E+01 |
92 |
0.05 |
0.87 |
1.761E+00 |
3.913E+01 |
4.083E+01 |
65 |
0.03 |
0.90 |
1.299E+00 |
4.083E+01 |
4.254E+01 |
77 |
0.04 |
0.94 |
1.605E+00 |
4.254E+01 |
4.424E+01 |
50 |
0.03 |
0.97 |
1.085E+00 |
4.424E+01 |
4.594E+01 |
31 |
0.02 |
0.98 |
6.988E-01 |
4.594E+01 |
4.764E+01 |
20 |
0.01 |
0.99 |
4.679E-01 |
4.764E+01 |
4.934E+01 |
13 |
0.01 |
1.00 |
3.152E-01 |
0.000E+00 |
0.000E+00 |
0 |
0.00 |
0.00 |
0.000E+00 |
Expected Value = 2.984E+01
NOTICE
Although this program has been tested and experience would indicate that it is accurate within the limits given by the assumptions of the theory used, we make no warranty as to workability of this software or any other licensed material. No warranties either expressed or implied (including warranties of fitness) shall apply. No responsibility is assumed for any errors, mistakes or misrepresentations that may occur from the use of this computer program. The user accepts full responsibility for assessing the validity and applicability of the results obtained with this program for any specific case.