|
<< Click to Display Table of Contents >> Layout Tab |
  
|
|
<< Click to Display Table of Contents >> Layout Tab |
|
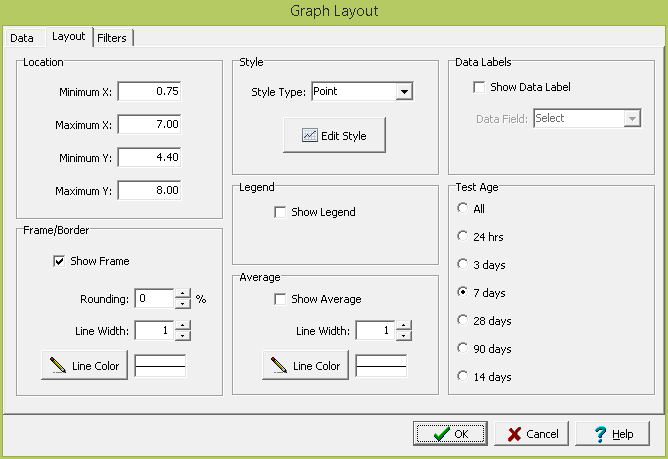
The following information can be specified on the Layout tab:
Location: This is used to specify the location of the graph on the template in the same units as the template page units (inches or millimeters).
Frame Border: This is used to specify whether to draw a border around the table. If a border is being drawn, the width, color, and rounding of the border line can be specified. The title of the table can optionally be included inside or above the frame.
Style: This is used to select the style for the graph; either, Points, Line, Area, or Bar. The type of styles that can be selected will depend on the graph and data types.
Edit Style: Click this button to edit the style of the graph. The style characteristics are a grouped into these categories:
•Series Display Parameters
•General Display Properties
•Axis Display Properties
•Titles Display Properties
•Legend Display Properties
•Panel Display Properties
•Paging Display Properties
•Walls Display Properties
•3D Display Properties
Legend: Check to show a legend with the graph. When checked the position (Top, Bottom, Left, Right) can also be selected.
Average: For Geotechnical Tests and Water Levels graphs the average of the data can be drawn as a horizontal line on the graph. If checked, the line width and color can be selected.
Data Labels: Check this box to display a data label at each data point on the graph. If checked, the data field to use for the data label can be selected.
Test Age: If the graph type is Geotechnical Tests and the media type is Concrete, this is used to select the test age for the samples.
Non-detects: If the graph type is Lab Analyses, this is used to select how to display non-detects on the graph. The options are to not include them, show them as zero, show them as the EQL, or show them as the MDL.
Water Strikes: If the graph type is Water Levels, check this box to display water strikes and water levels on the graph.