|
<< Click to Display Table of Contents >> Environmental Data |
  
|
|
<< Click to Display Table of Contents >> Environmental Data |
|
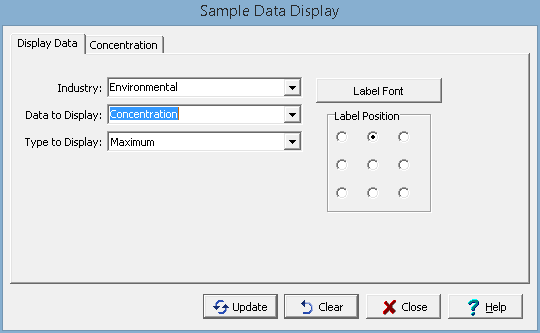
The following can be entered on this tab:
Industry: This is used to select the industry type for the data. It can be either environmental or geotechnical.
Data to Display: This is used to select the sample data to show on the map. The sample data that can be selected will depend on the industry.
Type to Display: This is used to select which data to display at each station location when there is more than one sample for a station. It can be either the maximum, minimum, average, most recent or oldest.
Label Font: This is used to select the font to use for the labels.
Label Position: The label can be positioned around the sample by selecting the position relative to the center of the sample.
If the data to display is Concentration, the Concentration tab will be shown.
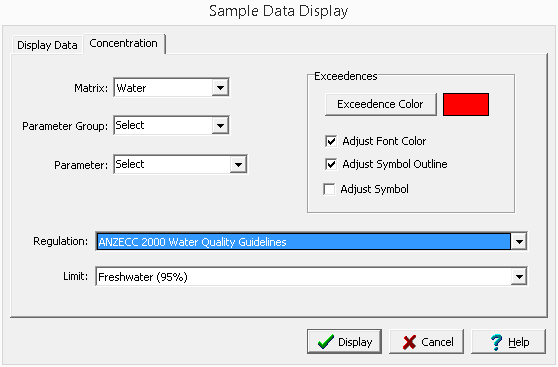
The following can be entered on this tab:
Matrix: This is used to select the sample matrix for display. Only data from samples with is matrix will be displayed.
Parameter Group: This contains a list of parameter groups for the given matrix that have sample data. It can also contain individual parameters if they were selected for lab analysis for a sample.
Parameter: This is the parameter in the parameter group to display.
Regulation: This is used to select the regulation used to determine exceedences.
Limit: This is used to select the limit within the regulation.
Exceedence Color: This is the color to use for exceedences.
Adjust Font Color: Check this box to change the font color for exceedences.
Adjust Symbol Outline: Check this box to change the outline color of the symbol for sample exceedences.
Adjust Symbol: Check this box to change the symbol color for sample exceedences.
After the display data and options have been selected, click on the Display button to show the data at the sample locations. The sample data will be shown in a new layer on the map called Sample Data. The display of this layer can be turned on and off by checking the Sample Data layer in the layer list on the left of the screen.