|
<< Click to Display Table of Contents >> Boring/Well Data Tab |
  
|
|
<< Click to Display Table of Contents >> Boring/Well Data Tab |
|
Up to three vertical columns containing boring/well data and linked EDMS data can be displayed on the cross-section at the location of each boring/well. If there is no data for the Borings/Wells the columns will appear blank on the cross-section.
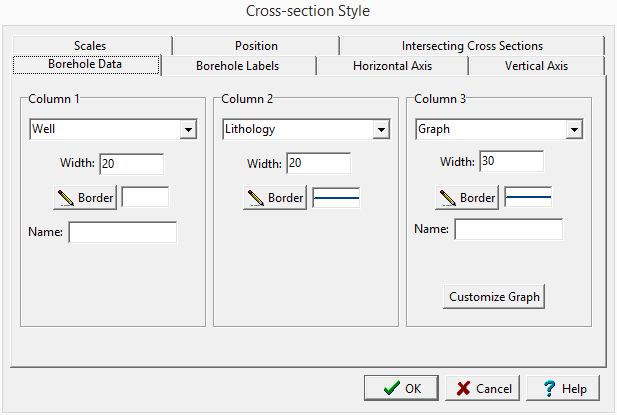
The tab is used to enter the following information:
Column 1: This is the type of boring/well data and linked EDMS data to display in the first column. To select the type of data click on the arrow at the right. If the data type is specified as a bar, a vertical bar will be drawn at the location of the column using the color of the border line.
Column 2: This is the type of borehole data to display in the second column.
Column 3: This is the type of borehole data to display in the third column.
Width: This is the width of either column 1, 2, or 3 specified in the same coordinates as the scales. For example, if the horizontal scale is 5 m/cm, a column width of 10 would be 2 cm wide on the page.
Border: This is the style of the line used to draw the border around either column 1, 2, or 3. When the Border button is pressed a Line Properties form will be displayed. This form can be used to specify the line width, color, and style.
Name: When the column data type is specified as graph, well, or geophysical log the name is used to specify which data to plot in the column. This is useful when the boring/well logs contain multiple graphs, wells, or geophysical logs and you want to specify which one will be plotted. If the name is left blank the first graph, well, or geophysical log will be plotted. If the column data type is multi-graph or multi-geophysical log, there will be two name fields. One for the first graph or log and one for the second graph or log. When specifying the Name it must match exactly what is in the boring/well.
Customize Graph: If the column data type is graph, double graph, geophysical log, or double geophysical log the Customize Graph button will be displayed. This button is used to specify the format of the graph in the column. When the Customize Graph button is pressed the Customize Graph Column form described in the section below will be displayed.
Customize Text: If the column data type is text or sample type the Customize Text button will be displayed. This button is used to specify the format of the text in the column. When the Customize Text button is pressed the Customize Text Column form described in the section below will be displayed.