|
<< Click to Display Table of Contents >> Customize Graph Columns |
  
|
|
<< Click to Display Table of Contents >> Customize Graph Columns |
|
If the column type is a multi-graph or multi-geophysical log, then the Customize Graph Columns form will have additional tabs for each graph or geophysical log. Each tab is used for one of the graphs or geophysical logs. The data entry for tabs is identical.
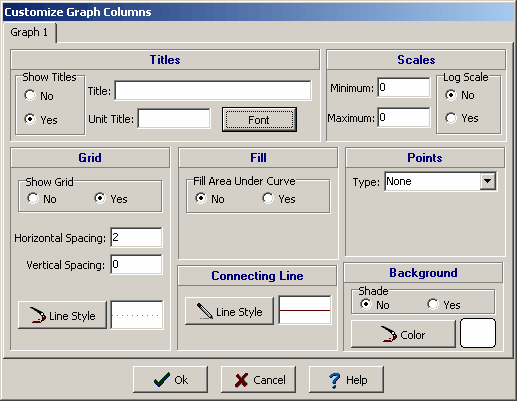
The Customize Graph Columns form can be used to specify the following parameters:
Show Titles: This is used to select whether to show the titles for the graph on the cross-section.
Graph Title: This is the title to use for the graph (up to 255 characters). The Graph Title will be displayed at the top of the column.
Units Title: This is the units of the graph (up to 255 characters). The unit title will be displayed below the graph title.
Minimum Scale: This is the minimum value for the horizontal axis of the graph. If the value is zero, the program will calculate the minimum value based on the data specified.
Maximum Scale: This is the maximum value for the horizontal axis of the graph. If the value is zero, the program will calculate the maximum value based on the data specified.
Log Scale: The horizontal axis can have either a linear or a logarithmic scale.
Show Grid: To draw horizontal and vertical grid lines, set Show Grid to yes.
Horizontal Spacing: This is the horizontal spacing of the grid lines. If set to zero no grid lines will be displayed.
Vertical Spacing: This is the vertical spacing of the grid lines. If set to zero no grid lines will be displayed.
Grid Line Style: This is the line style to use to draw the grid. When the Line Style button is pressed a Line Properties form will be displayed. This form can be used to set the line style, width, and color.
Fill Area Under Curve: The curve formed by the graph points can be filled with a solid color. The fill will be between the left side of the column and the curve.
Fill Color: This is the color to use for the fill. When the Color button is pressed a Color form will be displayed. This form can be used to select a basic or custom color. If Fill Area Under Curve is set to "no", this field will not appear.
Connecting Line Style: The data points for the graph can be connected by a line. To change the line style press the Line Style button, a Line Properties form will be displayed. This form can be used to select the line style, width, and color. If the line style is set to "none" no line will connect the points.
Point Type: The graph data can be shown as circles, crosses, squares, squares, triangles, or inverted triangles. To not show the data points, select "none". If this is a Bargraph column the point type is set to "none" and this field will not appear.
Point Size: This is the size of the data points. If the Point Type is set to “'none” this field will not appear.
Point Color: This is the color of the data points. To change the color, press the Color button, a Color form will be displayed. This form can be used to select a basic color or a custom color. If the Point Type is set to "none" this field will not appear.
Background Shade: This is used to specify whether the background behind the graph will be shaded or transparent. If the background is not shaded the cross-section strata will appear behind the graph.
Background Color: This is the color to shade the background. When the Background Color button is pressed, a Color form will be displayed. This form can be used to select a basic or custom color.