|
<< Click to Display Table of Contents >> Axis Display Properties |
  
|
|
<< Click to Display Table of Contents >> Axis Display Properties |
|
The second chart editor page holds the properties for defining axis and frame characteristics.
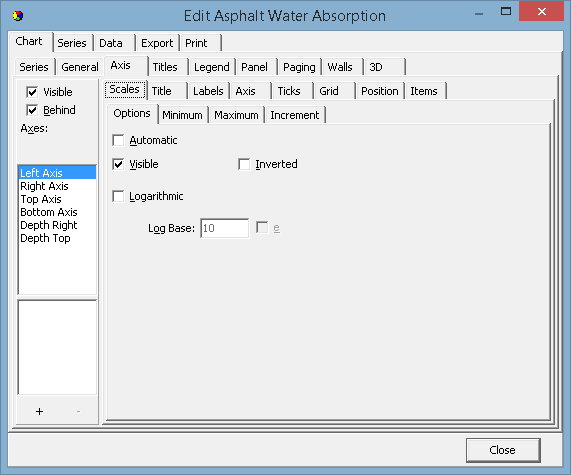
There are 5 axes in the Chart. Left, Top, Right, Bottom and Depth. The chart frame displays as a surround to the chart's plottable area. The depth initializes by default as not Visible. All other axes are visible from the moment that a series is added to the chart and associated with those axes (Left and Bottom as default). Custom axes may be added/removed by using the + and - keys on the dialogue. For a Custom Axis to be visible (as for any other Axis) a series must be associated with the axis.
The key properties to enable display of axes and frame are:
Visible
This checkbox enables or disables display of all axes. If the back wall frame is visible then the chart surround is still visible when the axes are hidden. The result will be the appearance of a larger chart as no area is reserved for the axis labels. The Visible property for each axis (Scales tab) overrides the visible characteristic for each axis. If you select the Depth Axis in the list then you will note that Depth Axis Scales::Visible is by default 'not visible'.
Axis: Left, Right, Top, Bottom and Depth Visible
Select the axis that you wish to display or hide in the list box and toggle the Visible checkbox on the Scales tab to control the display for that specific axis.