|
<< Click to Display Table of Contents >> Panel Display Properties |
  
|
|
<< Click to Display Table of Contents >> Panel Display Properties |
|
The Panel page allows you to set parameters which can greatly enhance the appearance of the chart.
.
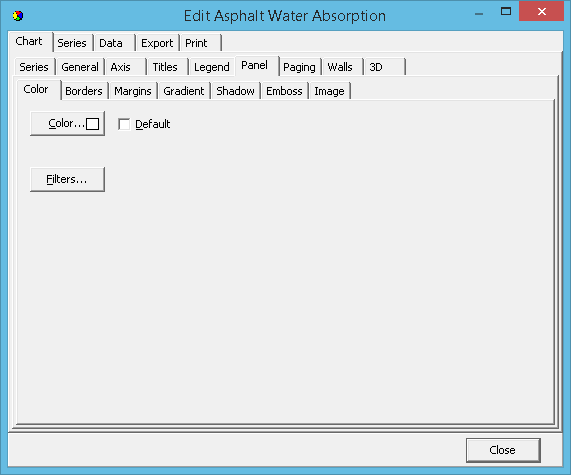
Color
Color will paint the whole chart background with the chosen color. If you select to view a background gradient or image, they will hide the panel color. If you set a Back colour it will replace the Panel colour within the chart frame only.
Border
You may define the border independently or in conjunction with the bevel properties. With Border set to visible you will obtain a 'sunken' border effect on the outside of the chart. Mixing bevel and border and manipulating width gives almost any combination of 3D effects. These properties will produce a variety of 3D effects on the border.
Margin
You can determine the margin size around the panel. Each chart has four margin properties: Margin Left, Margin Right, Margin Top and Margin Bottom. Margins are defined as the distance between the chart border and the chart frame and are expressed as a percentage of the overall dimensions of the chart. Default values are 4% for top and bottom margins and 3% for left and right margins.
Gradient
To define a gradient you must select a Start Color and End Color (plus, optionally Mid-Color) and enable as Visible the gradient. The gradient will cover the whole chart. Gradient direction defines the direction of colour change between Start, Mid and End Color.
Shadow
You may also add a shadow to the outside of the chart when Shadow Visible is enabled. By adjusting the colour, size and transparency, and in conjunction with Bevel and Border properties impressive 3D effects can be obtained. Use negative values for the vertical and horizontal sizes if you require shadows at the top or left of the chart respectively.
Image
You may select any bitmap (.bmp) file as a background Image. The image may be centered, tiled or stretched on the chart, or may be restricted to the chart frame boundaries.