|
<< Click to Display Table of Contents >> Legend Display Properties |
  
|
|
<< Click to Display Table of Contents >> Legend Display Properties |
|
In the Legend page of the Chart Editor you may define appearance aspects of the Legend.
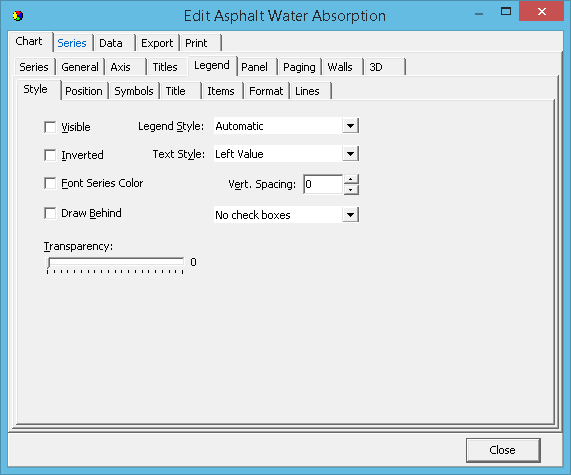
Style
Toggle On/Off Legend display and set legend display content characteristics.
Lines
Used to draw lines within the legend box between the legend entries.
Position
Sets the default display position or enables custom positioning of the Legend. The chart will change the shape of the legend to fit the location. If the legend is set to the side (left or right) of the chart the contents of the legend, by default, sit as a list from top to bottom. If the Legend sits below or above the chart then the Legend contents are placed side by side.
Symbols
Size and formatting of the legend symbols.
Title
Defines the characteristics for the legend title and legend title box.
Border
You may define the border independently or in conjunction with the bevel properties. Mixing bevel and border and manipulating width gives almost any combination of 3D effects.
Text
Text characteristics for the legend text contents.
Gradient
Enable/disable a background gradient in the legend box.
Shadow
Adds a shadow to the legend border.
Emboss
Adds a embossed effect to the legend border.
Picture
An image can be used for the background to the legend box instead of a using colours. By applying filters to the image, it can be modified so as to get the best result.