|
<< Click to Display Table of Contents >> Reporting |
  
|
|
<< Click to Display Table of Contents >> Reporting |
|
After the data has been entered and the results calculated they are displayed on a one page report. The format and layout of this report is defined by the template that was selected when the test was created. Depending on the template, a report can have one or more elements consisting of title blocks, legends, tables, graphs, etc. The majority of the information on the report is filled in by the program. On some title blocks there is user specified information that can be entered. To enter this information, edit the title block
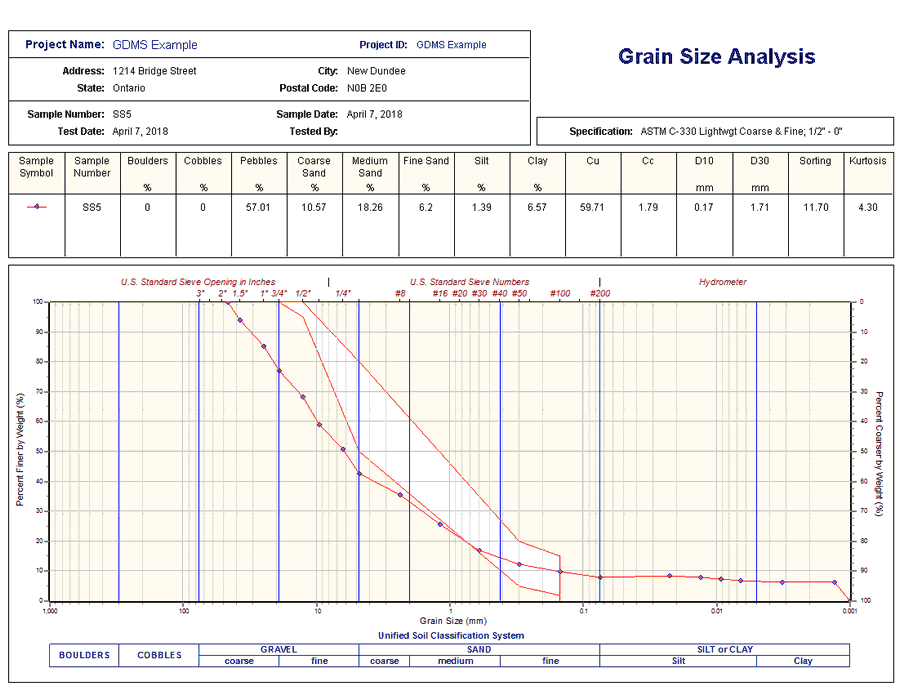
The classification system, specification, and format of the sieve analysis display is determined by the graph options specified in the template. If specified in the template, the classification system is plotted beneath the grain size graph and the sieve sizes are plotted above the graph. Using the grain size distribution curve and classification system a variety of information can be automatically calculated and displayed in the legend.This information includes soil and aggregate composition, loss, skewness, Kurtosis, sorting, mean, Cu, Cc, D10, D30. and D60. In addition, grain size specifications can be plotted on the graph to indicate whether the sieve analysis meets specifications or not. These specifications are selected from a previously defined list of standard and custom specifications.
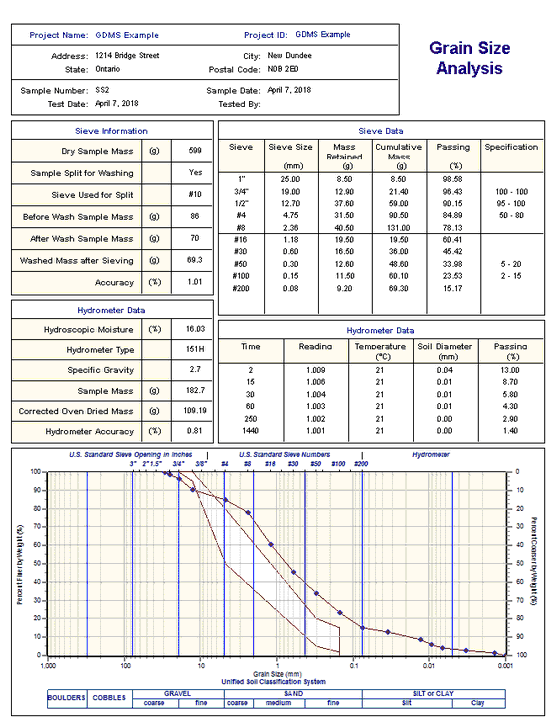
Sieve data and hydrometer data can be displayed in separate tables on the report. The sieve data table also displays the washed sieve data if the sample was split for washing. The washed sieve data is displayed below the line in the table.
Additional test results from other tests can be shown on the report by adding them using the Edit menu. The additional test results will be shown in the legend and graphs, but will not be shown in any of the tables.
A datasheet containing all of the data and results can also be displayed and printed. The datasheet will contain a text version of the data and results for the test. It will not contain any additional test results that are added from other tests.
This report can be printed or exported to a PDF file.