|
<< Click to Display Table of Contents >> Contours Tab |
  
|
|
<< Click to Display Table of Contents >> Contours Tab |
|
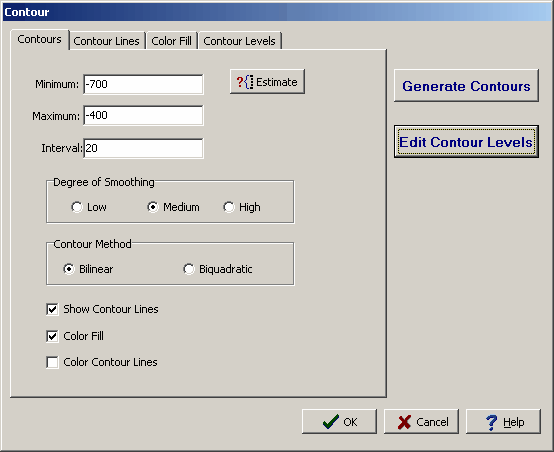
The following information can be entered on the Contours tab:
Minimum: This is the minimum level or contour line to draw.
Maximum: This is the maximum level or contour line to draw.
Interval: This is the interval between contour levels or lines.
Estimate: Click this button to have the program estimate the contour minimum, maximum, and interval.
Degree of Smoothing: This is the degree of smoothing to apply to the contours.
Contour Method: This is the method to use to calculate the contours, either bilinear or biquadratic.
Show Contour Lines: Check this box to show the contour lines on the map.
Color Fill: Check this box to show color fill between contours on the map.
Color Contour Lines: Check this box to use variable color contour lines.