|
<< Click to Display Table of Contents >> Data Boundary Tab |
  
|
|
<< Click to Display Table of Contents >> Data Boundary Tab |
|
To define a different boundary for the data for a fault block uncheck the "Use same boundary for data" box on the Fault Block tab. The Data Boundary Tab will be added to the form.
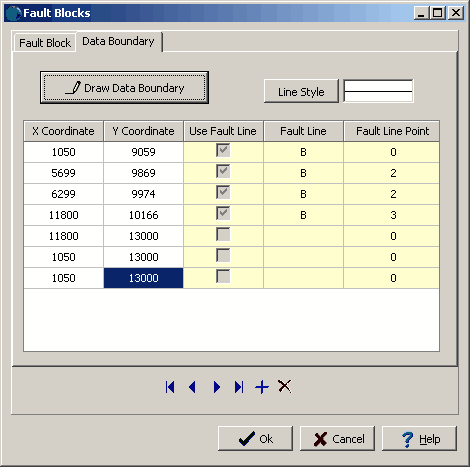
The following information can be entered on this tab:
Draw Data Boundary: Initially the data boundary will be the same as the fault block, to draw a different boundary click on this button. The form will temporarily disappear and the new boundary can be drawn the same way a polygon by clicking on the vertices of the boundary. When the last vertex is reached double-click to return to the Fault Blocks form.
Line Style: Click this button to change the line style for the data boundary. A Line Properties form will be displayed where the style, color, and width of the line can be selected.
X Coordinate: This is the x coordinate of the point on the boundary.
Y Coordinate: This is the y coordinate of the point on the boundary.
Use Fault Line: This box will be checked if the point is from a fault line. If the box is not checked a map boundary is being used for the point. This is assigned when the fault block is drawn and can not be edited.
Fault Line: This is the fault line that the point belongs to. If it is blank the point is a map boundary. This is assigned when the fault block is drawn and can not be edited.
Fault Line Point: If the point is from a fault line, this is the point number in the fault line. This is assigned when the fault block is drawn and can not be edited.