|
<< Click to Display Table of Contents >> Filtering the Data |
  
|
|
<< Click to Display Table of Contents >> Filtering the Data |
|
Filtering the data can be used to remove values based on high and low pass filters. To filter the data click on the Filter button on the Data Operations form. A new tab will be displayed for the Filter Data.At the top of this tab a histogram will be displayed showing the calculated number of data at different ranges of values. The data within the specified filter will be shown in yellow on the histogram and the data outside of the filter will be shown in red.
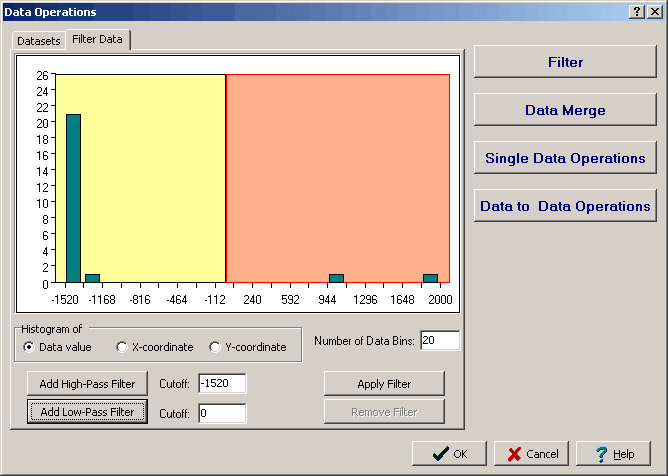
The following can be entered on this tab:
Histogram of: The data can be filtered by value, x-coordinate, or y-coordinate. This is used to select how to filter the data and the histogram to display.
Number of Data Bins: The data is divided into the specified number of data bins for display in the histogram.
Add High-Pass Filter: Click this button to add the specified cutoff for the high-pass filter.
Add Low-Pass Filter: Click this button to add the specified cutoff for the low-pass filter.
Apply Filter: Click this button to apply the filter to the data.
Remove Filter: This will remove the filter from the data.