|
<< Click to Display Table of Contents >> Gridding Data |
  
|
|
<< Click to Display Table of Contents >> Gridding Data |
|
![]()
After the datasets have been added to the map, they can be gridded. The grid can cover the entire map, a rectangular portion or a polygonal portion of the map. After this the Grid form will be displayed.
Entire Map Area
To cover the entire map select Edit > Grid, Popup > Grid or click on the Grid Button on the toolbar.
Rectangular Map Area
![]()
To select a rectangular area for the grid either select Edit > Grid Boundaries > Rectangular or click on the Define Grid Boundary button on the toolbar and select Rectangular. Then click on one corner of the rectangle on the map and drag the cursor to the opposite corner. After this the Grid form will be displayed.
Polygonal Map Area
![]()
To select a polygonal area for the grid either select Edit > Grid Boundaries > Polygonal or click on the Define Grid Boundary button on the toolbar and select Polygonal. Then click on the vertices of the polygon, when the last vertex is reached double-click the mouse.After this the Grid form will be displayed.
Depending on the grid method selected the Grid form may have one to three tabs. The first tab is for Grid Information, the second is for any additional information for the grid method, and the third is for control points on the grid. The information for these tabs is described in the sections below.
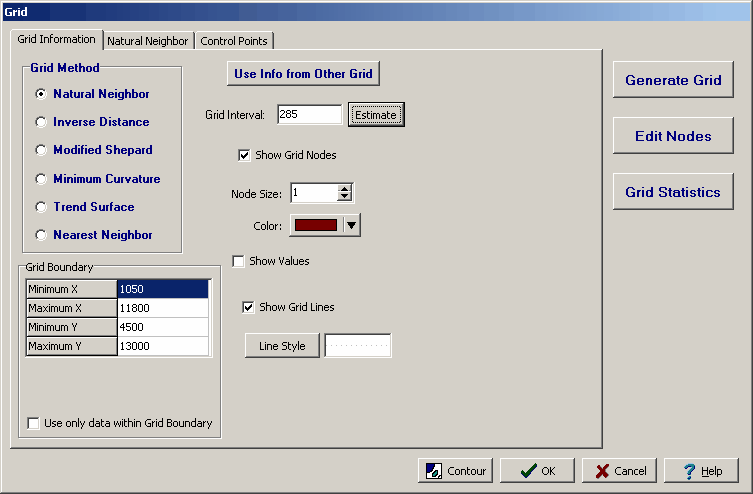
After the grid information has been entered click on the Generate Grid button to create the grid.