|
<< Click to Display Table of Contents >> Data Tab |
  
|
|
<< Click to Display Table of Contents >> Data Tab |
|
The Data tab is used to specify the charts that will be included in the report chart.
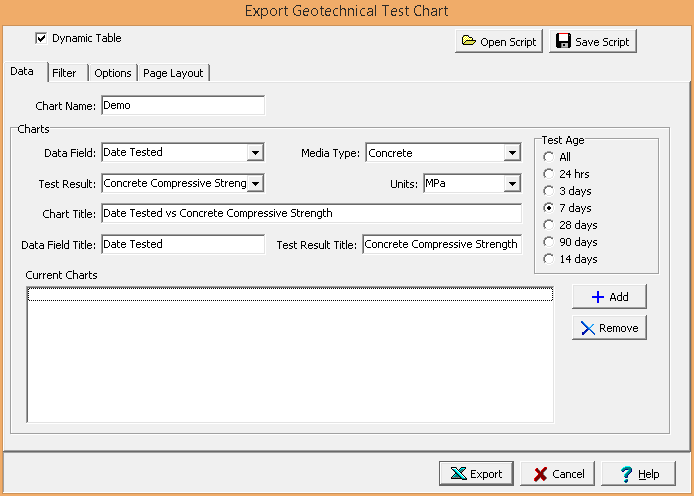
The following can be specified on this tab:
Chart Name: This is name of the chart for the data.
Data Field: This is used to select the data field that will be displayed in the chart.
Media Type: This is used to select the media type for the chart. The media type selected will determine the test result that can be used for the chart.
Test Result: This is used to select the test result to be displayed.
Units: This is used to select the units for the test result selected.
Chart Title: This is the title of the chart. If it is blank it will be filled in when the data field and parameter are specified.
Data Field Title: This is used to specify the title of the data field (X) axis.
Test Result Title: This is used to specify the title of the test result (Y) axis.
Test Age: If the media type is concrete, this is used to select the test ages to include.
Add: Click on the Add button to add the chart to the list of charts to be included.
Remove: Click the Remove button to remove the selected chart from the list.