|
<< Click to Display Table of Contents >> Statistics Tab |
  
|
|
<< Click to Display Table of Contents >> Statistics Tab |
|
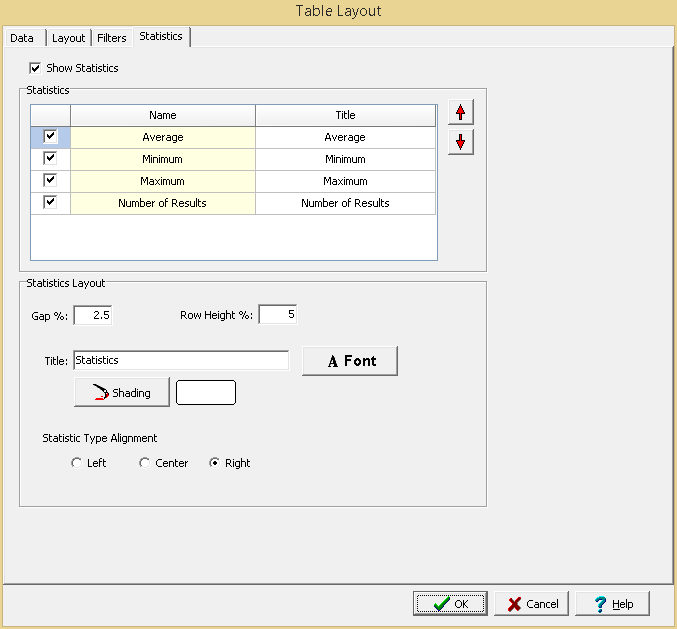
This tab is used to select the type and layout of statistics to show for Geotechnical Tests, Lab Analyses, and Water Levels tables.
Show Statistics: Check this box to show statistics for the table data.
Statistics: The average, minimum, maximum, and number of results can be shown by checking the boxes on the left. In addition, for Lab Analyses tables the Number of Detects and Number of Exceedences can be shown. For each statistic the title to display in the table can be specified.
Statistics Layout: The units for the data can be shown in the table. If the units are being shown then the following can be specified:
Gap: For vertical tables this is used to specify the vertical gap between the table and statistics as a percentage of the table height. For horizontal tables this is used to specify the horizontal gap between the table and statistics as a percentage of the table width.
Row Height %: If the table is oriented vertically the row height of the units can be specified as a percentage of the total height of the table.
Column Width %: If the table is oriented horizontally the column width of the units can be specified as a percentage of the total width of the table.
Title: This is used to specify the title for the statistics.
Font: This is used to select the font for the title.
Shading: This is used to select the background shading of the title box for the statistics.
Position: If the table is oriented vertically the units can either be at the top of the data or bottom of the data. If the table is oriented horizontally the units can either be on the left or right of the data.
Alignment: This is used to select the horizontal alignment of the statistics.