|
<< Click to Display Table of Contents >> Concentration vs Time |
  
|
|
<< Click to Display Table of Contents >> Concentration vs Time |
|
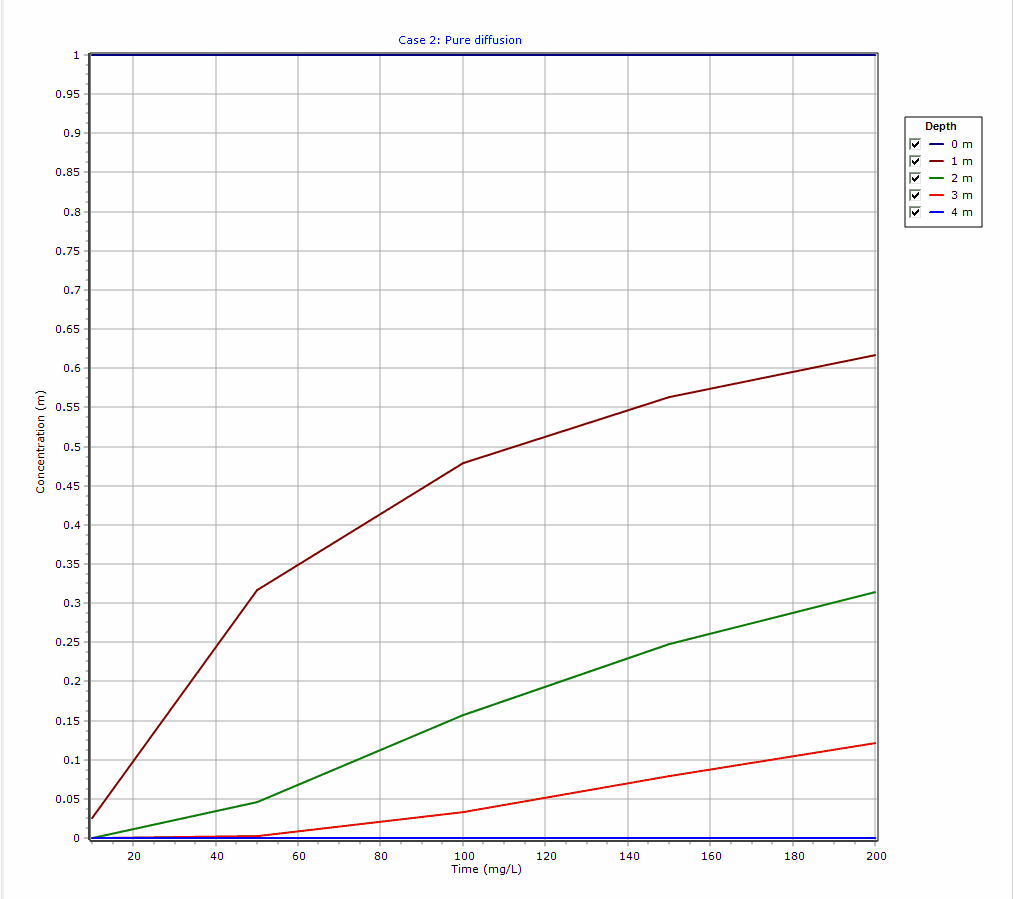
This chart will display the concentration versus time for each of the depths specified in the model. The curve for each depth can be turned on and off using the check boxes in the legend.