|
<< Click to Display Table of Contents >> Editing Chart Grid Options |
  
|
|
<< Click to Display Table of Contents >> Editing Chart Grid Options |
|
![]()
If the chart type is Concentration vs Depth vs Time or Depth vs Time, the chart is displayed as a grid and the grid options can be edited by pressing the Options button on the Graph tab. The Chart Options form will be displayed.
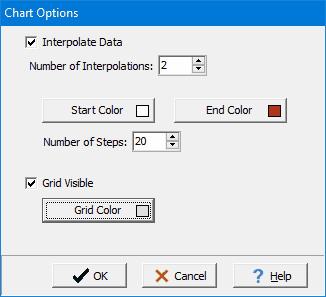
The following can be edited on this form:
Interpolate Data: Check to interpolate the data for the grid. This will interpolate between data values to create a finer grid mesh.
Number of Interpolations: This is used to specify the number of interpolations between data values. The higher the number of interpolations the finer the grid mesh. Generally, a value between 2 and 4 is recommended.
Start Color: This is used to select the start color for the lowest concentration in the grid.
End Color: This is used to select the end color for the highest concentration in the grid.
Number of Steps: This is the number of steps (intervals) in color between the start and end colors.
Grid Visible: Check to make the grid lines visible.
Grid Color: This is used to select the color of the grid lines.