|
<< Click to Display Table of Contents >> Editing the Chart Title |
  
|
|
<< Click to Display Table of Contents >> Editing the Chart Title |
|
The chart title can be formatted using the Titles sub-section. Several tabs control the format of the title and are described briefly below.
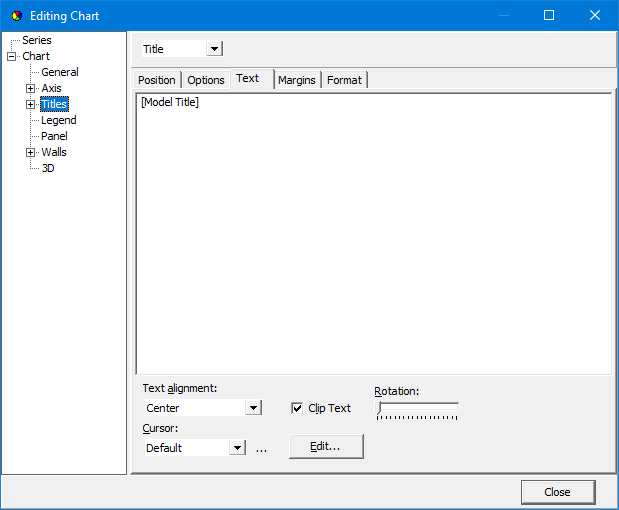
The following are some of the most pertinent items that can be edited:
Position Tab
Vert. Margin: This is used to specify the margin between the title and chart.
Options Tab
Visible: Check this to show the title on the chart.
Alignment: This is used to select the alignment of the title relative to the chart.
Text Tab
Text: This is the title to show for the chart. If the text contains [Model Title], the model title used for the actual model will be substituted. For the Probability vs Concentration chart if the text contains [Max Conc], the maximum concentration for the model result will be substituted. For the Probability vs Time chart if the text contains [Max Time], the time of the maximum concentration for the model result will be substituted. For the Probability vs Variable Value chart if the text contains [Expected Value], the expected value of the variable for the model result will be substituted.
Format Tab
Font: This is used to set the font for the title.