|
<< Click to Display Table of Contents >> Customizing the Deviation Survey Column |
  
|
|
<< Click to Display Table of Contents >> Customizing the Deviation Survey Column |
|
The style of the Deviation Survey column can be changed using the Customize button on the Columns tab. When the Customize button is pressed the Customize Deviation Survey Column form will be displayed. The Deviation Survey Form has two tabs one for the profile direction/layout and one for the line style/point type.
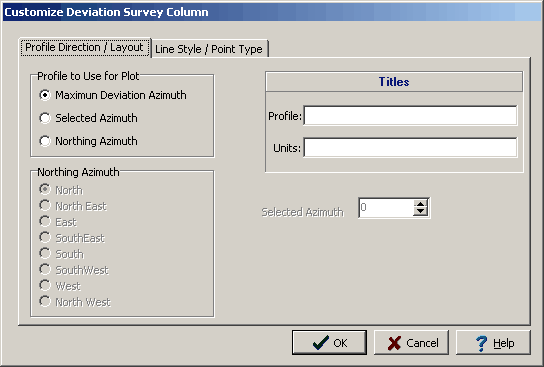
Profile Direction/Layout Tab
(The appearance of the form will differ slightly depending on if it is WinLoG or WinLoG RT)
The following can be edited on this tab:
Profile To Use for the Plot: This is the profile type that is used to draw the Deviation Survey. There are three choices:
1.Maximum Deviation Azimuth: This is the azimuth of maximum deviation as calculated by the program using the deviation survey data.
2.Selected Azimuth: If the user selects the profile type as Selected Azimuth then this field is enabled and the user can select any Azimuth between 0 and 360 degrees to draw the deviation survey profile.
3.Northing Azimuth: If the user selects the profile type as Northing Azimuth then this radio button is enabled and the user can select any of the eight azimuths to use to draw the deviation survey profile.
Profile Title: This is the title to use for the Deviation Survey Column. The title will be displayed in the same area as the Column Title. It is recommended that either the Profile Title or Column Title be used, and not both.
Units Title: This is the units of the Deviation Survey. The unit title will be displayed below the Profile title.
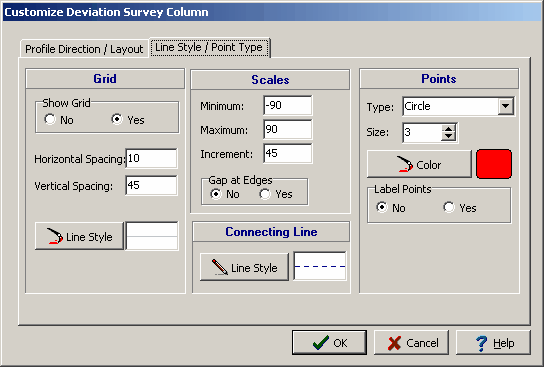
Line Style/Point Type Tab
(The appearance of the form will differ slightly depending on if it is WinLoG or WinLoG RT)
The Line Style/Point Type tab can be used to set the following:
Grid
Show Grid: To draw horizontal and vertical grid lines, set Show Grid to yes.
Horizontal Spacing: This is the horizontal spacing of the grid lines, usually the same as the scale increment. If set to zero, the scale increment will be used. If Show Grid is set to no, this field will not appear.
Vertical Spacing: This is the vertical spacing of the grid lines, usually the same as the scale increment. If set to zero, the scale increment will be used. If Show Grid is set to no,this field will not appear.
Line Style: This is the line style to use to draw the grid. When the Line Style button is pressed a Line Properties form will be displayed. This form can be used to set the line style, width, and color.
Scales
Minimum: This is the minimum value for the horizontal axis of the profile. If the value is zero, the program will calculate the minimum value based on the data specified.
Maximum: This is the maximum value for the horizontal axis of the profile. If the value is zero, the program will calculate the maximum value based on the data specified.
Increment: This is the increment to use for labeling the horizontal axis of the profile. If the value is zero, the program will calculate the increment based on the data specified.
Gap at Edges: This is used to select whether there should be a gap on the left and right sides of the column. By putting a gap on the sides there will be room to display the minimum and maximum labels of the profile within the column.
Connecting Line
Line Style: The data points for the profile can be connected by a line. To change the line style, press the Line Style button. A Line Properties form will be displayed. This form can be used to select the line style, width, and color. If the line style is set to "none", no line will connect the points.
Points
Type: The profile data can be shown as circles, crosses, squares, squares, triangles, or inverted triangles. To not show the data points, select "none".
Size: This is the size of the data points. If the Point Type is set to 'none’, this field will not appear.
Color: This is the color of the data points. To change the color, press the Color button. A Color form will be displayed. This form can be used to select a basic color or a custom color. If the Point Type is set to "none", this field will not appear.
Label Points: The values of the data points can be drawn above each point. If the data value is less than the minimum value, the value will be shown with a "<" symbol. If the data value is greater than the maximum value, the value will be shown with a ">" symbol. If the Point Type is set to "none", this field will not appear.