|
<< Click to Display Table of Contents >> Customizing the Grain Size Column (Not in Oil & Gas) |
  
|
|
<< Click to Display Table of Contents >> Customizing the Grain Size Column (Not in Oil & Gas) |
|
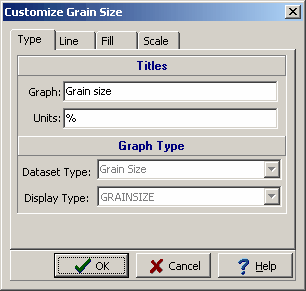
The format of the Grain Size column can be changed using the Customize button on the Columns tab. When this button is pressed the Customize Grain Size form will be displayed. This form has four tabs for specifying the type, lines, fill, and scale.
Type Tab
(The appearance of the form will differ slightly depending on if it is WinLoG or WinLoG RT)
The following can be edited on this tab:
Graph Title: This is the title to use for the graph. The graph title will be displayed in the same area as the column title. It is recommended that either the graph title or column title be used, and not both.
Units Title: This is the units of the graph. The unit title will be displayed below the graph title.
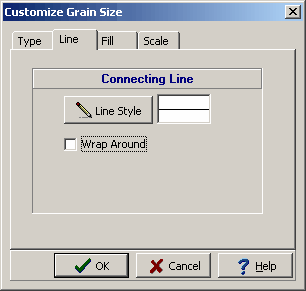
Line Tab
(The appearance of the form will differ slightly depending on if it is WinLoG or WinLoG RT)
The following can be edited on this tab:
Connecting Line Style: The data points for the graph can be connected by a line. To change the line style, press the Line Style button. The Line Properties form will be displayed. This form can be used to select the line style, width, and color. If the line style is set to “none”, no line will connect the points.
Wrap Around: Check this box to have the connecting line wrap from the right side of the column to the left side of the column. This is useful if some values on the graph are larger than the maximum for the graph, the value and connecting line will then wrap around the graph and start again from the left.
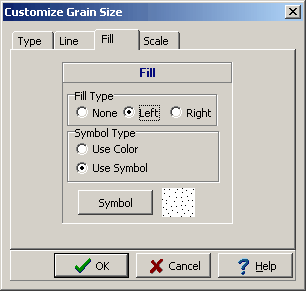
Fill Tab
(The appearance of the form will differ slightly depending on if it is WinLoG or WinLoG RT)
The following can be edited on this tab:
Fill Type: The curve formed by the graph points can be filled with a solid color. The fill can either be on the left or right side of the curve.
Symbol Type: The fill can either be a solid color or a symbol.. If the Fill Type is set to "none" this field will not appear.
Color: This is the color to use for the fill. When the Color button is pressed, the Color form will be displayed. This form can be used to select a basic or custom color. If the Fill Type is set to “none” or Symbol Type is set to Use Symbol, this field will not appear.
Symbol: Click this button to change the fill symbol. When this is button is pressed the Select Lithologic Symbol form will be displayed. Using this form, the library, symbol, foreground color, and background color can be selected. If the Fill Type is set to “none” or Symbol Type is set to Use Color, this field will not appear.
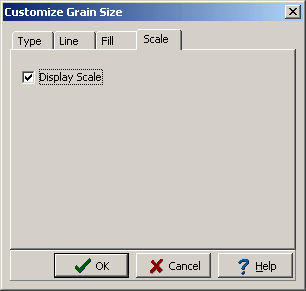
Scale Tab
(The appearance of the form will differ slightly depending on if it is WinLoG or WinLoG RT)
The following can be edited on this tab:
Display Scale: Check this box to display the scale at the top of the graph as part of the column titles.