|
<< Click to Display Table of Contents >> Point Tab |
  
|
|
<< Click to Display Table of Contents >> Point Tab |
|
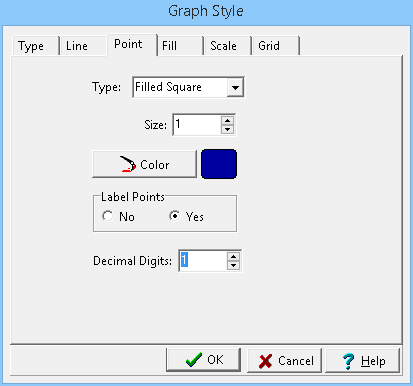
(The appearance of the form will differ slightly depending on if it is WinLoG or WinLoG RT)
The following can be edited on this tab:
Type: The graph data can be shown as circles, crosses, squares, squares, triangles, or inverted triangles. To not show the data points, select “none”. If this is a
Bargraph column, the point type is set to “none” and this field will not appear.
Size: This is the size of the data points. If the Point Type is set to ‘none’, this field will not appear.
Color: This is the color of the data points. To change the color, press the Color button. The Color form will be displayed. This form can be used to select a basic color or a custom color. If the Point Type is set to “none”, this field will not appear.
Label Points: The values of the data points can be drawn above each point. If the data value is less than the minimum value, the value will be shown with a “<” symbol. If the data value is greater than the maximum value, the value will be shown with a “>” symbol. If the Point Type is set to “none”, this field will not appear.
Decimal Digits: This is the number of digits after the decimal place to use for the label.