|
<< Click to Display Table of Contents >> Scale Tab |
  
|
|
<< Click to Display Table of Contents >> Scale Tab |
|
(The appearance of the form will differ slightly depending on if it is WinLoG or WinLoG RT)
The following can be edited on this tab:
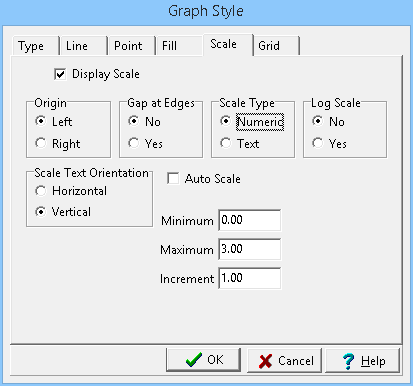
Display Scale: Check this box to display the scale at the top of the graph as part of the column titles.
Origin: This determines whether the scale origin is on the left or right side of the column.
Gap at Edges: This is used to set whether there is a gap between the edge of the graph and the column.
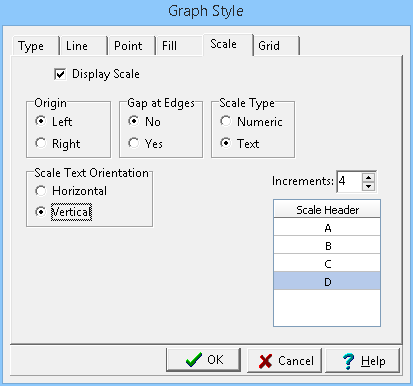
Scale Type: This is used to select whether the scale is numeric or text. Numeric scales are used to graph numeric data values. Text scales are used to graph text values; such as weathering. Only numeric scales can be in log scale.
Log Scale: The horizontal axis can have either a linear or a logarithmic scale.
Scale Text Orientation: This is used to select whether the scale text should be oriented horizontally or vertically.
Auto Scale: For a numeric scale check this to automatically set the scale based on the data in the graph. If this box is checked the Minimum, Maximum, and Increment can not be edited.
Minimum: For a numeric scale this is the minimum value for the graph. If the Auto Scale box is checked this field can not be edited.
Maximum: For a numeric scale this is the maximum value for the graph. If the Auto Scale box is checked this field can not be edited.
Increment: For a numeric scale this is the increment to use for labeling the axis of the graph. If the Auto Scale box is checked this field can not be edited.
Increments: For a text scale this is the number of text increments in the graph. It includes the first and last text headers. The first and last text headers will not be displayed unless there is a gap at the edges. Each increment will be evenly spaced on the graph.
Scale Header: For a text scale these are the headers to use for the graph. When the log is created these headers will be used to select the text values for the data points.