|
<< Click to Display Table of Contents >> Sensitivity Analysis |
  
|
|
<< Click to Display Table of Contents >> Sensitivity Analysis |
|
In the description of a soil deposit and a contaminant source (eg. a landfill) the values of all the input data are not always known with certainty. For example, the length of time that the primary leachate collection system will function before becoming clogged [Rowe and Fraser, 1993a, 1993b]. However, if the minimum and maximum values (Uniform Distribution) of the parameter can be estimated then Sensitivity Analysis can be used to predict the expected range of contaminant concentrations.
This feature is vary similar to Monte Carlo simulation; except, that when performing a Sensitivity Analysis only one variable may be evaluated at a time. Monte Carlo simulation can not be used at the same time as a Sensitivity Analysis. This is a computationally intensive feature, and the user should be aware that it may take anywhere from a few minutes to hours to complete with computation time depending on the speed of the computer, the number of simulations to be performed, the number of layers, and the Talbot integration parameter ‘N’. For this reason the Auto Run option can not be used with this feature.
To add this feature check the Sensitivity Analysis box on the Special Features tab. The Sensitivity Analysis form will be shown on the right side of the tab.
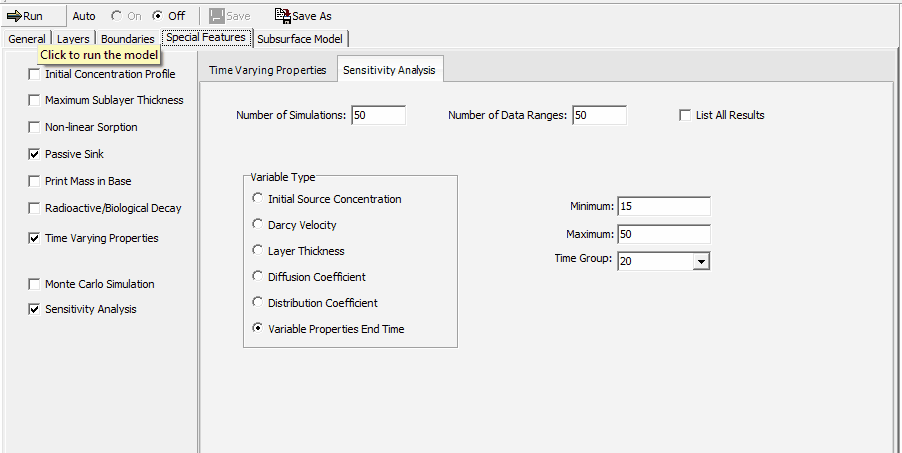
The following can be specified:
Number of Simulations: This is the number of simulation analyses (realizations) to make, during each simulation the probability distributions of each variable are randomly sampled and the concentrations calculated. To obtain sufficiently reliable results at least 500 simulations are recommended, and for some cases between 1000 to 10000 simulations (realizations) may be required. The user should experiment with this parameter to determine the sensitivity of the results to the number of simulations.
Number of Data Ranges: This is the number of data ranges to divide the probability distributions into in the output of the results of the simulation. A maximum of 20 ranges may be specified. This parameter does not affect the accuracy of the results and is for display purposes only.
List All Results: By selecting this option, the user can obtain a list of all the simulation results. Listing all the results will include the results of every simulation pass in the output, the output file that is obtained may be extremely large. This option can be used to list all the results for a limited number of simulations (e.g. 10), to obtain a better idea of how the program is functioning, prior to running it for all the simulations.
Variable Type: This is the type of data for which the user wishes to enter a uniform distribution. There are 6 types of data that can be used:
Initial Source Concentration: This is the Initial Source Concentration of the top boundary, and can only be used if the top boundary condition is NOT zero flux.
Darcy Velocity: This is the Darcy Velocity of the model.
Layer Thickness: This allows the user to specify a distribution for the thickness of a layer. The user will be asked to specify the layer for which to vary the thickness.
Diffusion Coefficient: This is the Diffusion Coefficient of a layer, the user will be asked to specify the layer for which to vary the Diffusion Coefficient.
Distribution Coefficient: This is the Distribution Coefficient of a layer, the user will be asked to specify the layer for which to vary the Distribution Coefficient. If the layer selected is fractured the distribution coefficient along the fracture will be varied.
Variable Properties End Time: This is the End Time of a Variable Properties Time Group, the user will be asked to specify the Time Group for which to vary End Time. When varying the end time of a time group the program will shift the end times of subsequent time groups to maintain their relative position, and will try to keep the end times of any previous time groups the same. This variable type will not show up if the Variable Properties feature has not been previously selected.
Minimum: This is the minimum value of the uniform distribution for the variable.
Maximum: This is the maximum value of the uniform distribution for the variable.
Layer Number: If the variable type is Layer Thickness, Diffusion Coefficient, or Distribution Coefficient this is the layer to vary.
Time Group: If the variable type is Variable Properties End Time this is the end time of the time period to vary.