|
<< Click to Display Table of Contents >> Chart Tab |
  
|
|
<< Click to Display Table of Contents >> Chart Tab |
|
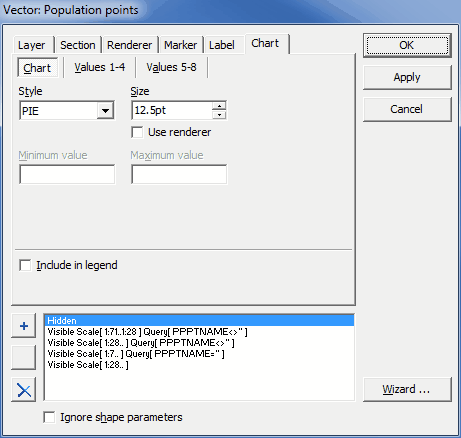
This tab is displayed only for vector layers and has three sub-tabs. The following information can be entered.
Chart
|
Style: The style of the chart. |
|
Size: The size of the chart; check Use renderer option below to use global renderer settings found on the Renderer tab. |
|
Minimum value: The bottom value for the chart; applies to BAR style chart only. |
|
Maximum value: The top value for the chart; applies to BAR style chart only. |
|
Include in legend: If checked, the chart symbol of the currently selected section is displayed in the Legend panel. |
Values 1-4/Values 5-8
|
Values: The attributes used to build the chart for each shape. |
|
Legends: The text that is displayed besides the chart symbol in the Legend panel. |
|
Include in legend: If checked, the chart symbol of the currently selected section is displayed in the Legend panel. |