|
<< Click to Display Table of Contents >> Grid Statistics |
  
|
|
<< Click to Display Table of Contents >> Grid Statistics |
|
After the grid has been generated the statistics for a grid can be displayed by clicking on the Grid Statistics button on the Grid form. The Grid Statistics tab will be added to the Grid form.
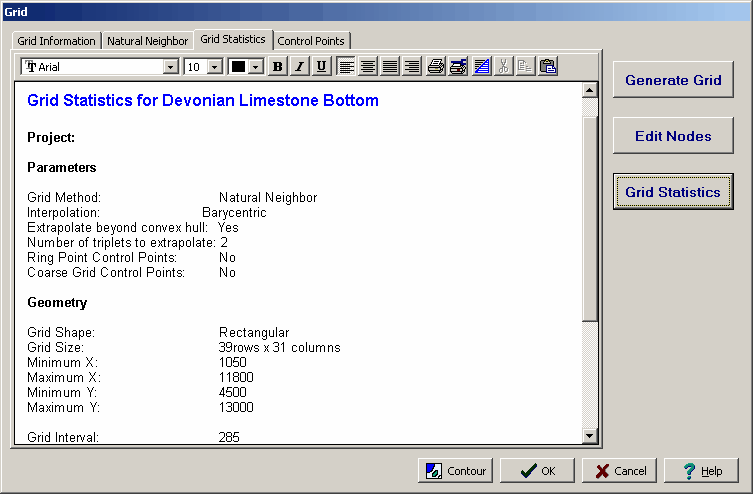
On this tab is a memo field that displays the statistics for the grid. The information in this field can be edited, printed and formatted using the rich text toolbar at the top of the form. The buttons of the toolbar perform the following functions:
•The Font Typeface box is used to select the name of the font to use for the selected text.
•The Font Size box is used to set the size of the font for the selected text.
•The Font Color box is used to select the color of the font for the selected text.
•The Bold button is used to toggle the bold attribute of the selected text on and off.
•The Italics button is used to toggle the italic attribute of the selected text on and off.
•The Underline button is used to toggle the underline attribute of the selected text on and off.
•The Left Justify button will left justify the selected text.
•The Center Justify button will center justify the selected text.
•The Block Justify button will block justify the selected text.
•The Right Justify button will right justify the selected text.
•The Print button will print the statistics.
•The Print Setup button can be used to setup the printer properties.
•The Select All button is used to select all of the text.
•The Cut button will remove the selected text and place it in the clipboard.
•The Copy button will copy the selected text to the clipboard.
•The Paste button will paste the text in the clipboard, at the current position of the cursor in the memo field.