|
<< Click to Display Table of Contents >> Editing the Series Format |
  
|
|
<< Click to Display Table of Contents >> Editing the Series Format |
  
|
The chart series can only be edited when editing a model. This section is ignored when editing a template.

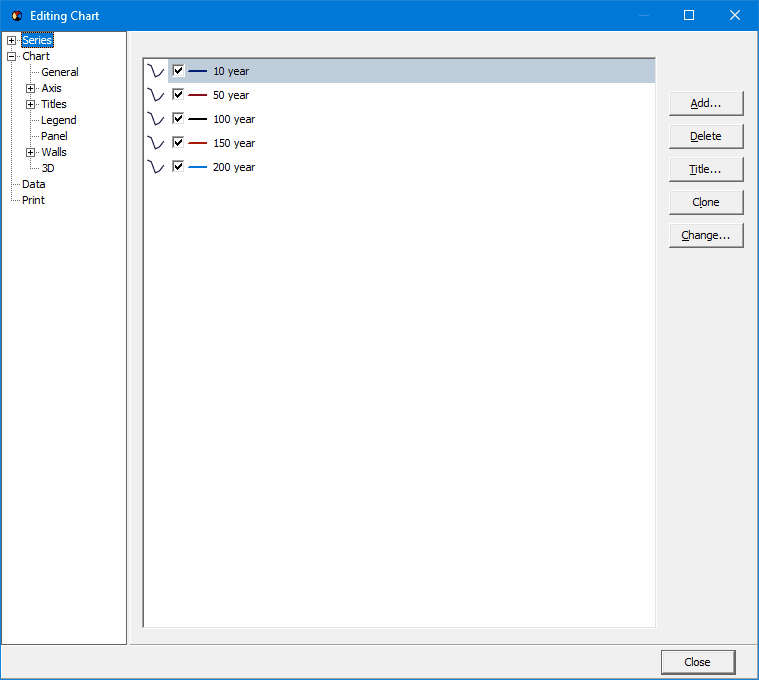
The section will display a list of the data series currently in the chart. In the following charts the series will be line series:
•Depth vs Concentration
•Concentration vs Time
•Flux vs Time
•Probability vs Concentration
•Probability vs Time
•Probability vs Variable Value
In the Concentration vs Depth vs Time chart the series will be a surface. And in the Depth vs Time chart the series will be a color grid.
It is recommended to only edit the Chart Line Options and Chart Grid Options to control the format for the series.